
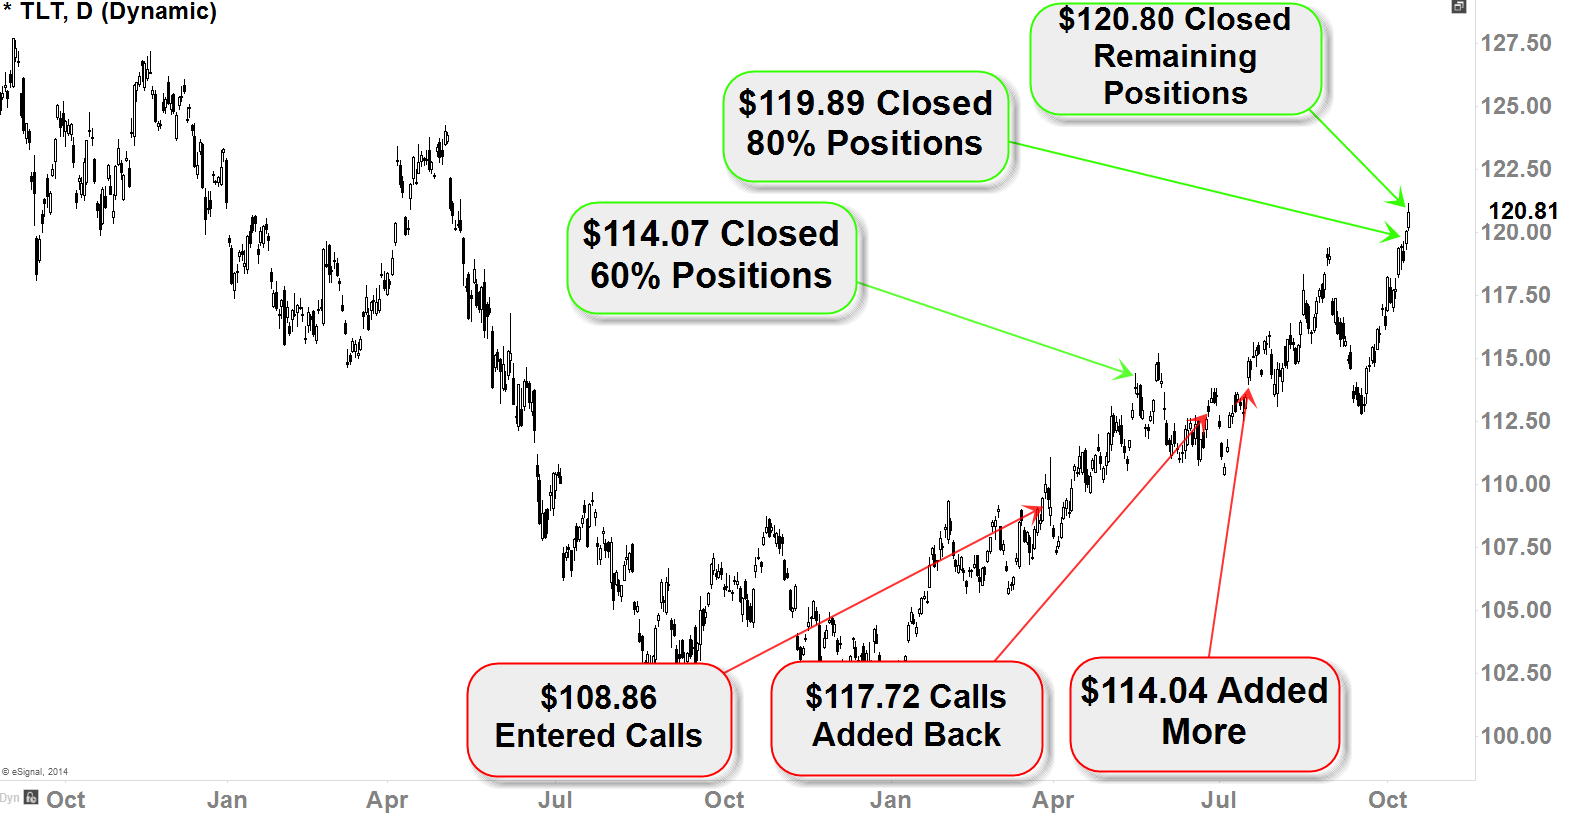
20+ Year Treasury Bond has been a solid position-trading vehicle for us since the late march of this year (see timeline). We’ve started accumulating our call-positions @ $108.86 (late march) and closing all of our positions @ $120.80 (mid-October) with great gain. Soon after we have completely closed our call-positions, Treasury Bond started to behave in a really volatile manner with huge fluctuations for few days (10/15/14 – 10/16/14), and then started declining. With a weekly and monthly warning signals (weekly and monthly ‘Shooting Star’ candles — see article), we’ve decided to patiently wait and see how it plays out. We did not want to short it because the primary-term uptrend was still strong and prominent; instead, we wanted to wait for the next long opportunity but we wanted to see how it’s going to react with the warning signals. Around mid-November, daily 50EMA started to act as support, and the Bonds started bounce; that was when we decided to restart the journey with the Treasury Bond to the upside.
On November 25th at $120.60, we initiated our call-positions with first target of $132ish.
I will be sharing many charts in this article today to show you how we initiated this move just few weeks back, and what we have been discussing for the sustenance and the ignition of this move.
Last Positions
[$TLT Daily Chart]
See articles here
Current Position Timeline
[$TLT Daily Charts]
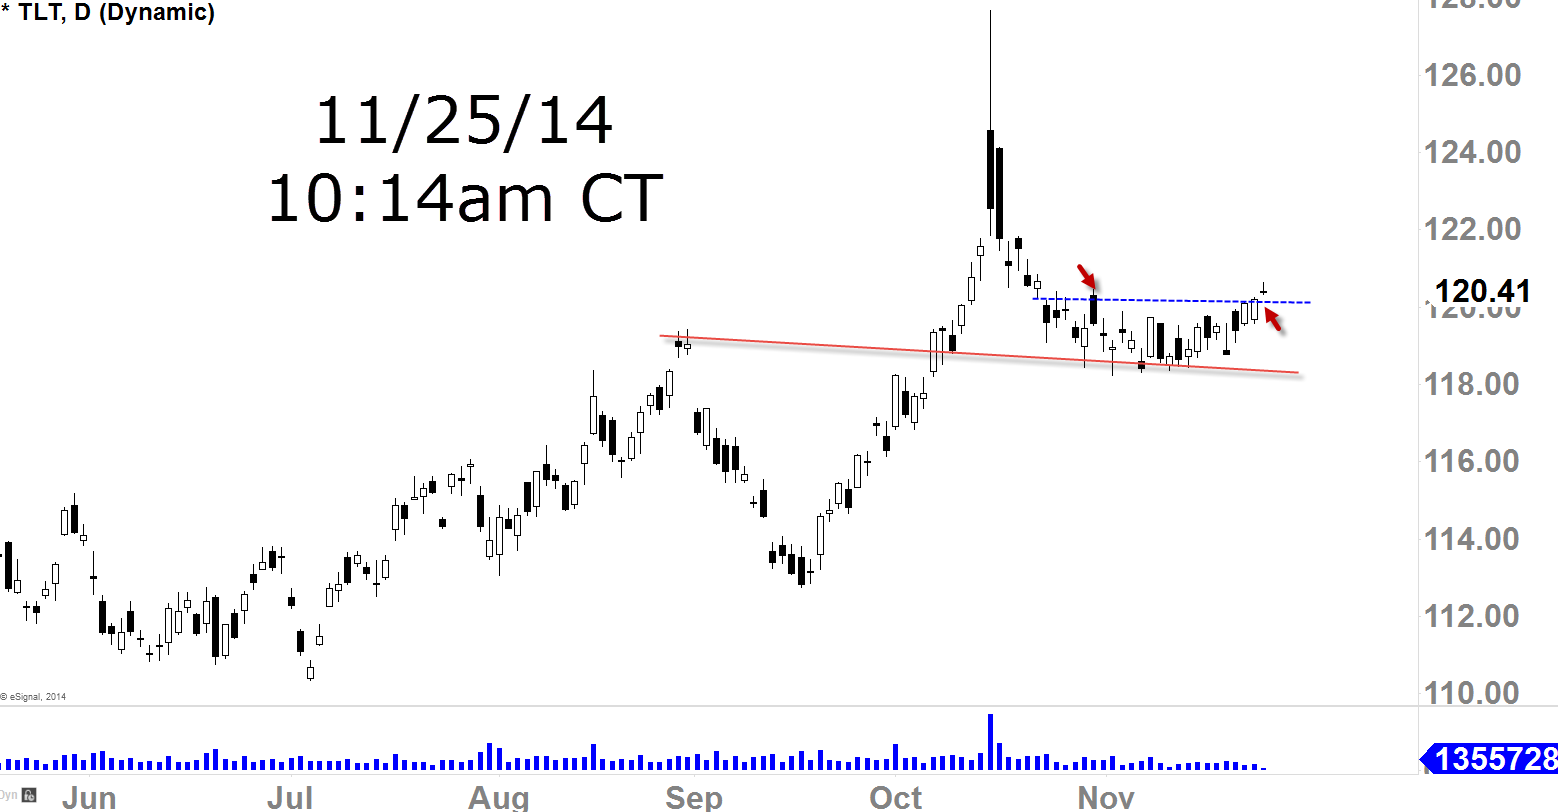
We started watching as it cleared above recent resistance level to make sure there is no fake-outs before initiating (see arrows).
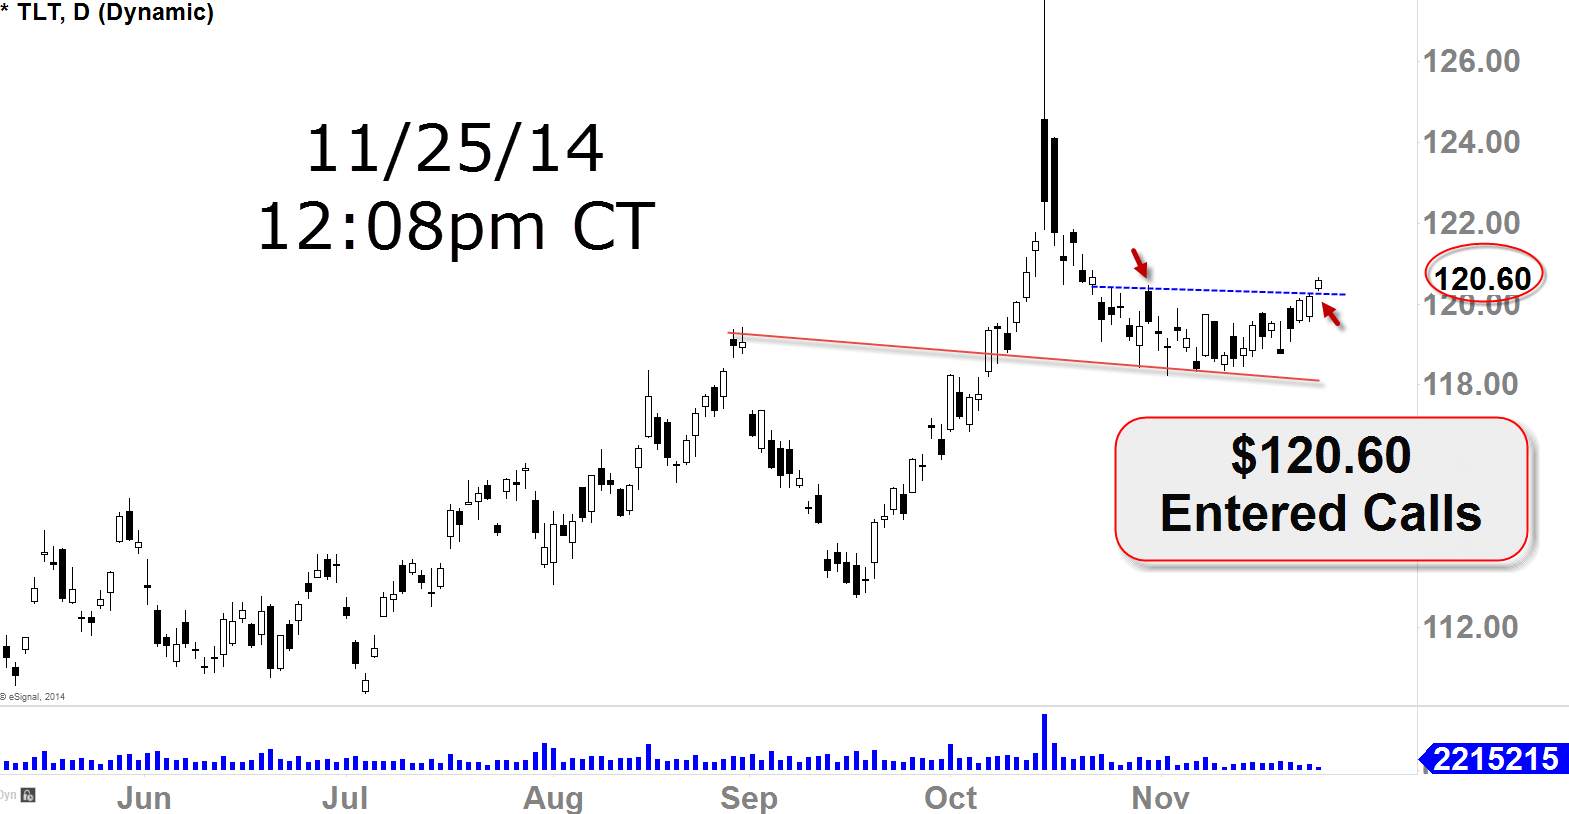
Around noon (central time) on November 25th, as the Treasury Bond started to gain intraday momentum and holding the new support level well, we’ve decided to enter calls @ $120.60.
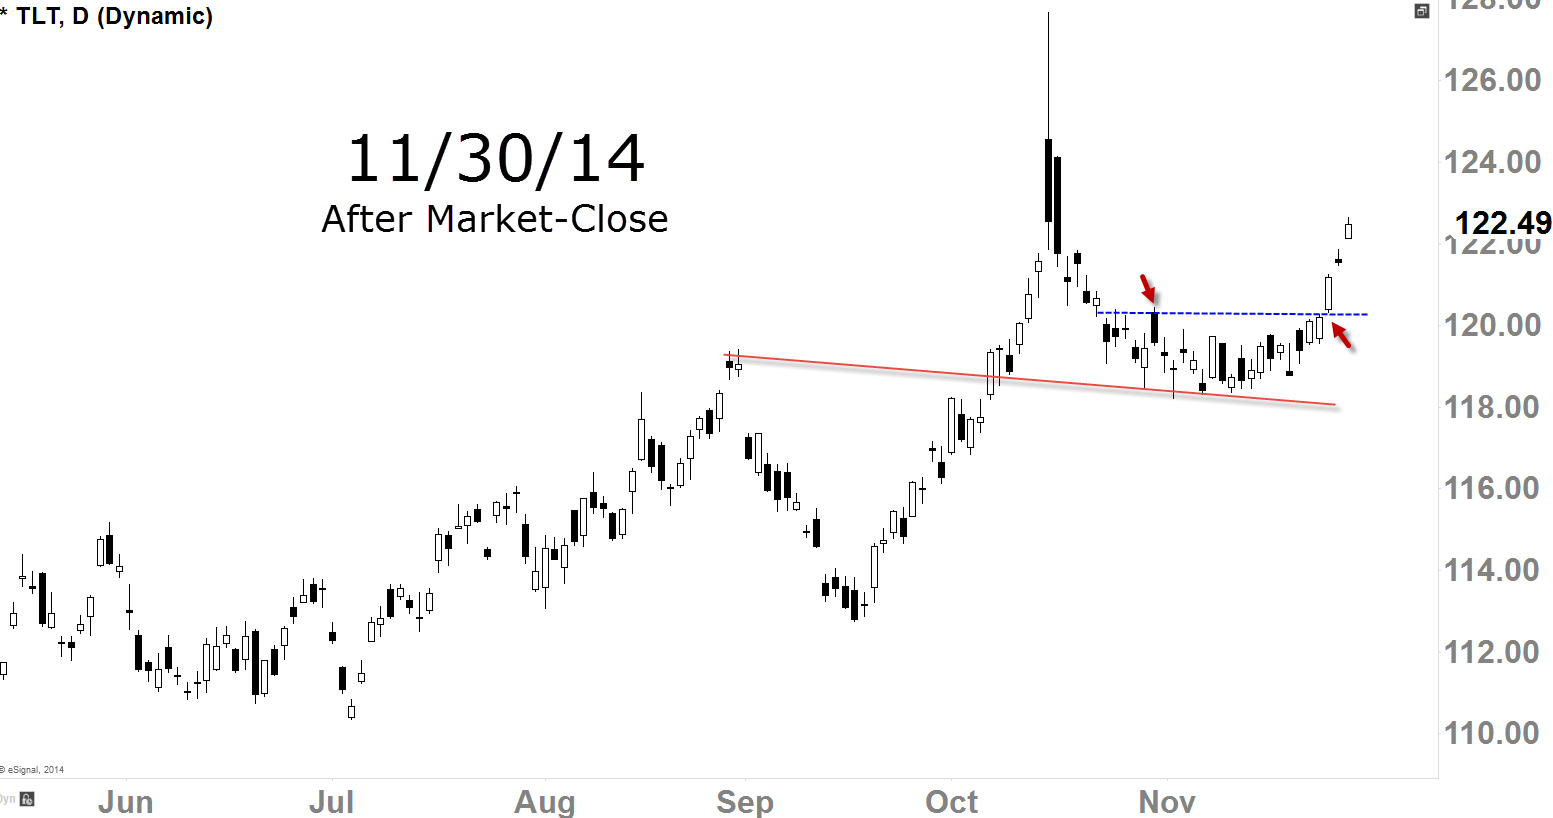
In just three days, it moved up well but I think we kind of had this hunch the bulls shake-out might be coming.
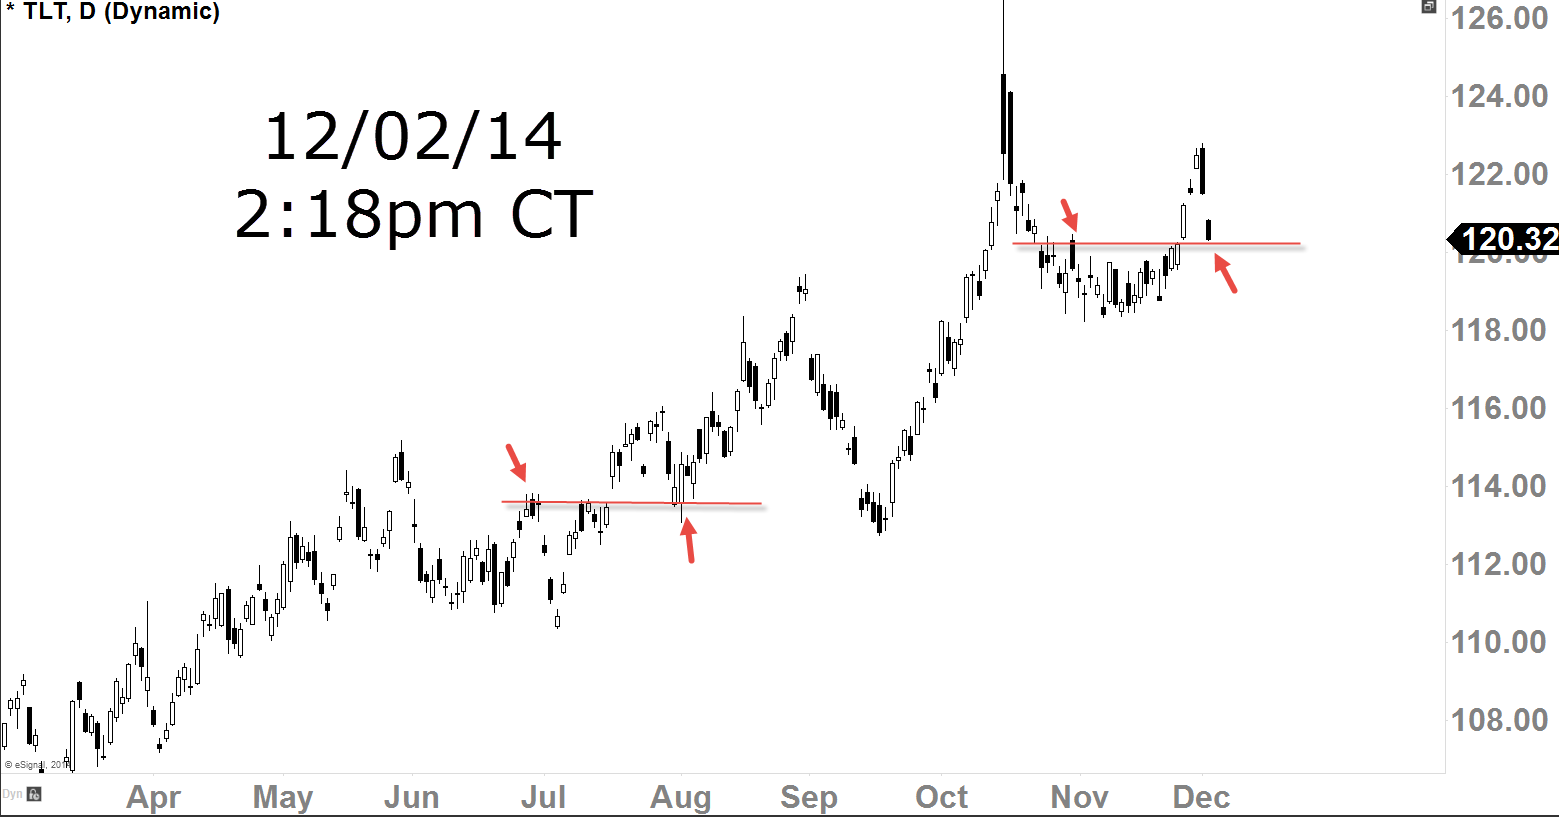
And indeed it did. But we understood that the old resistance level can become a new support (see arrows) so we didn’t panic but embraced this pullback for a potential higher-low action (similar to back in August).
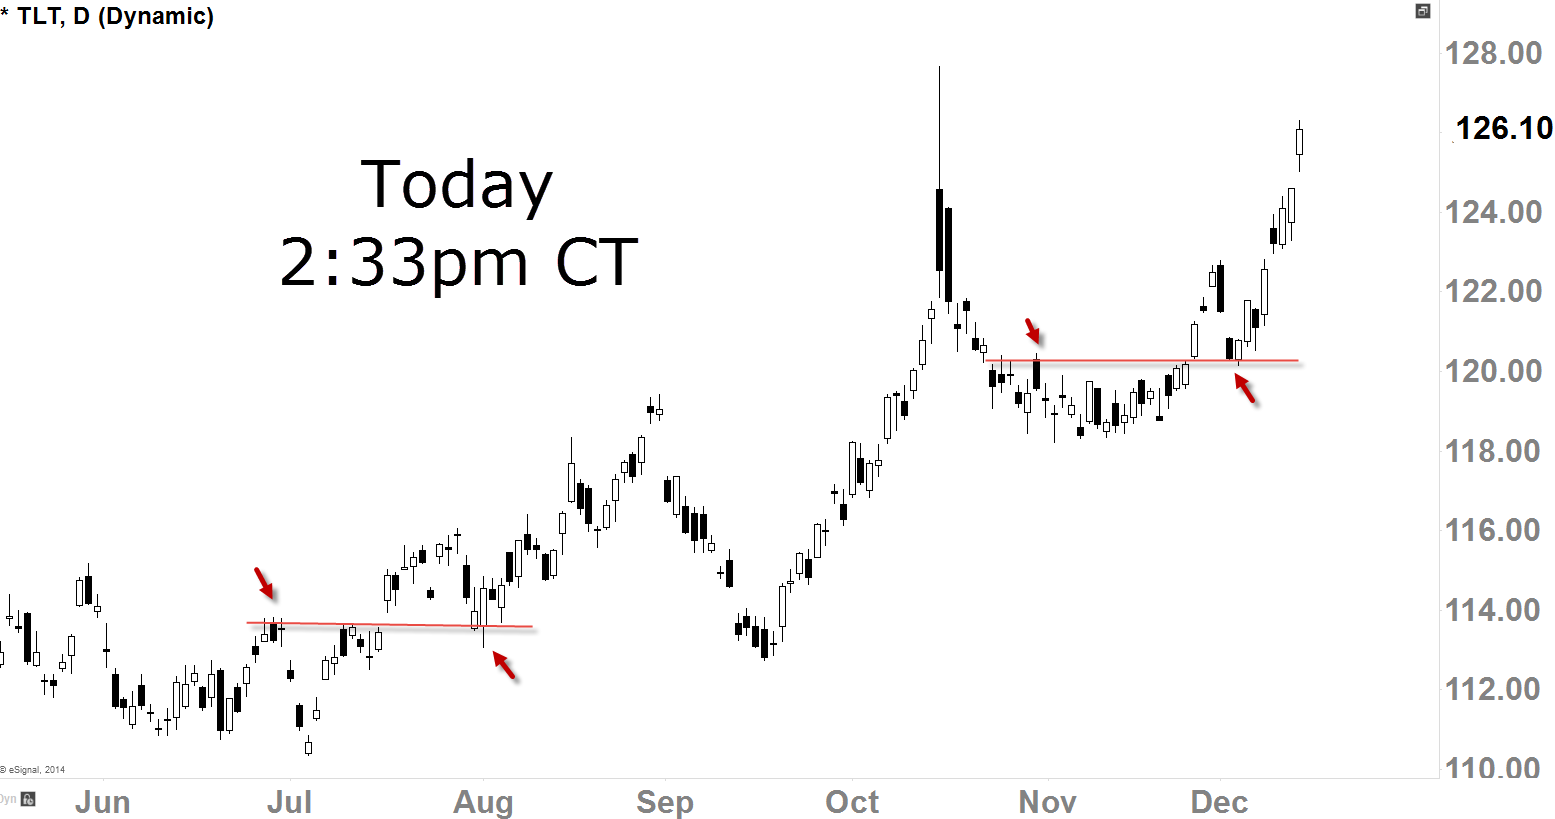
‘Old Resistance New Support’ theory played out well here, and in that process we have formed well-defined higher low which means intermediate-term uptrend is establishing well. I actually would rather see it pullback to create higher low like this because I think it forms more solid uptrend comparing to straight-up/parabolic move which isn’t so sustainable. I think $127 might be a resistance here and we may get a short-term pullback at that level.
Primary-Term Uptrend
[$TLT Daily Charts]
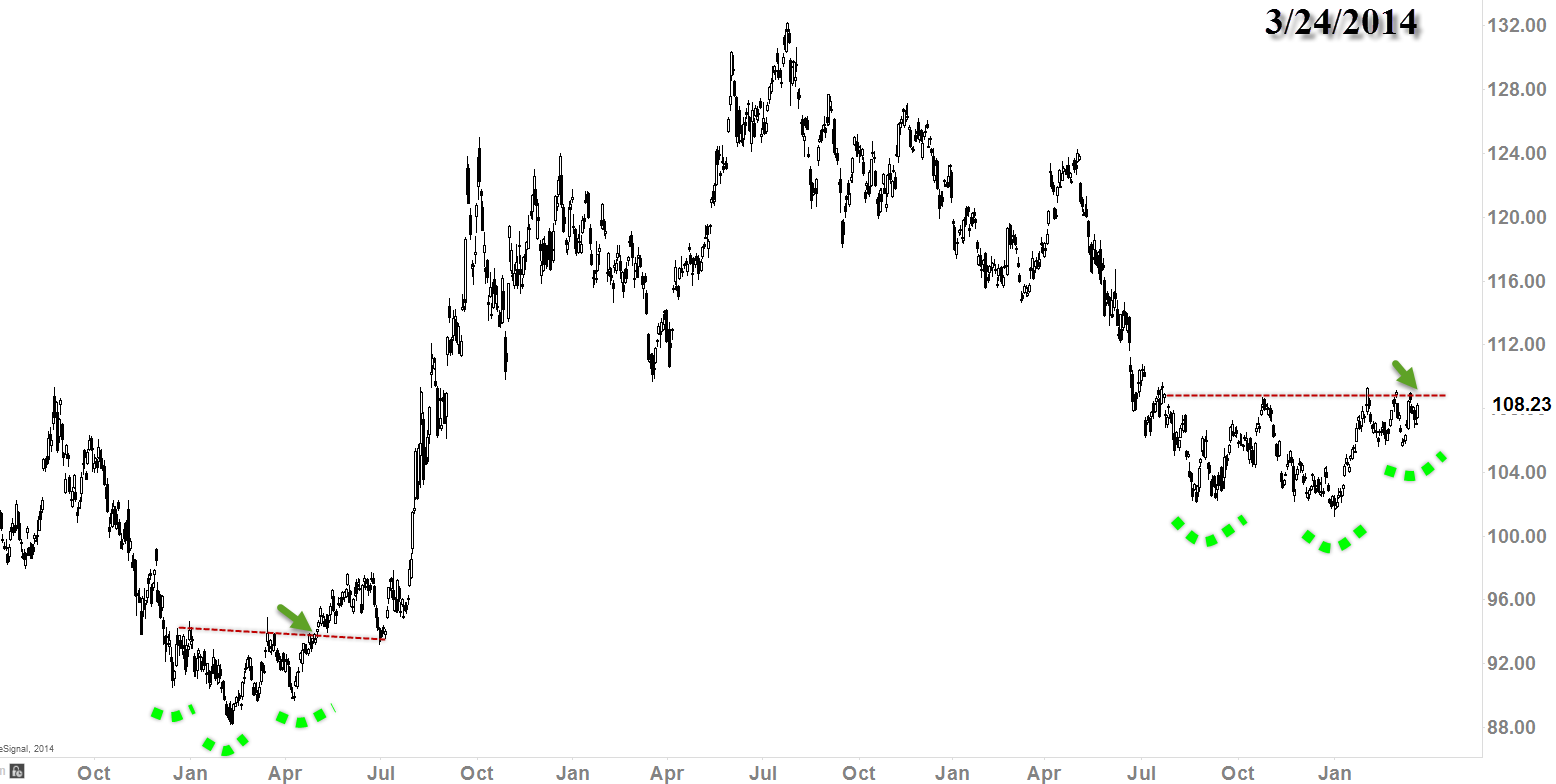
This was our first setup analysis back in late March.
With primary-term higher lows and higher highs in tact, benefit of the doubt continues to go to the buyers. We are still in an primary-term uptrend. As of today, we do not have any major-topping/reversal pattern.
Weekly Action
[$TLT Weekly Charts]
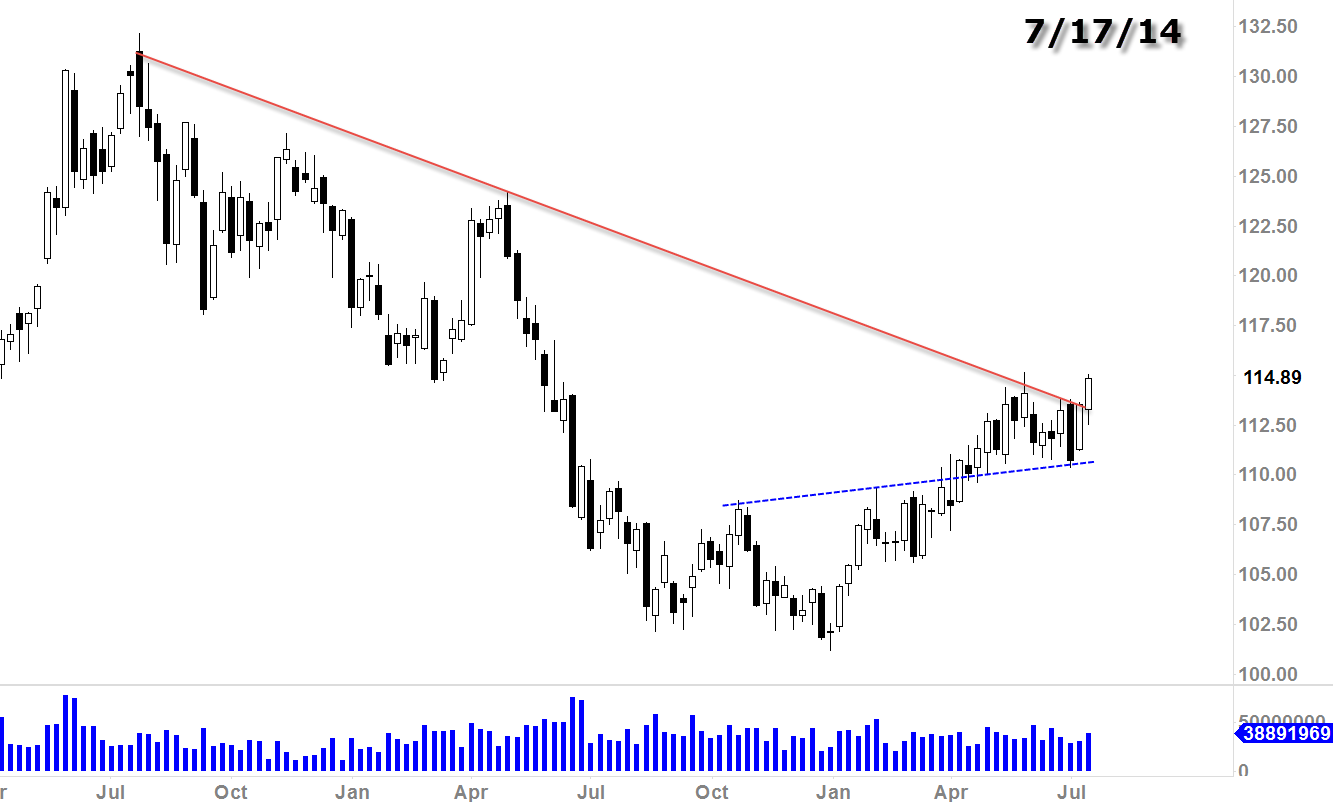
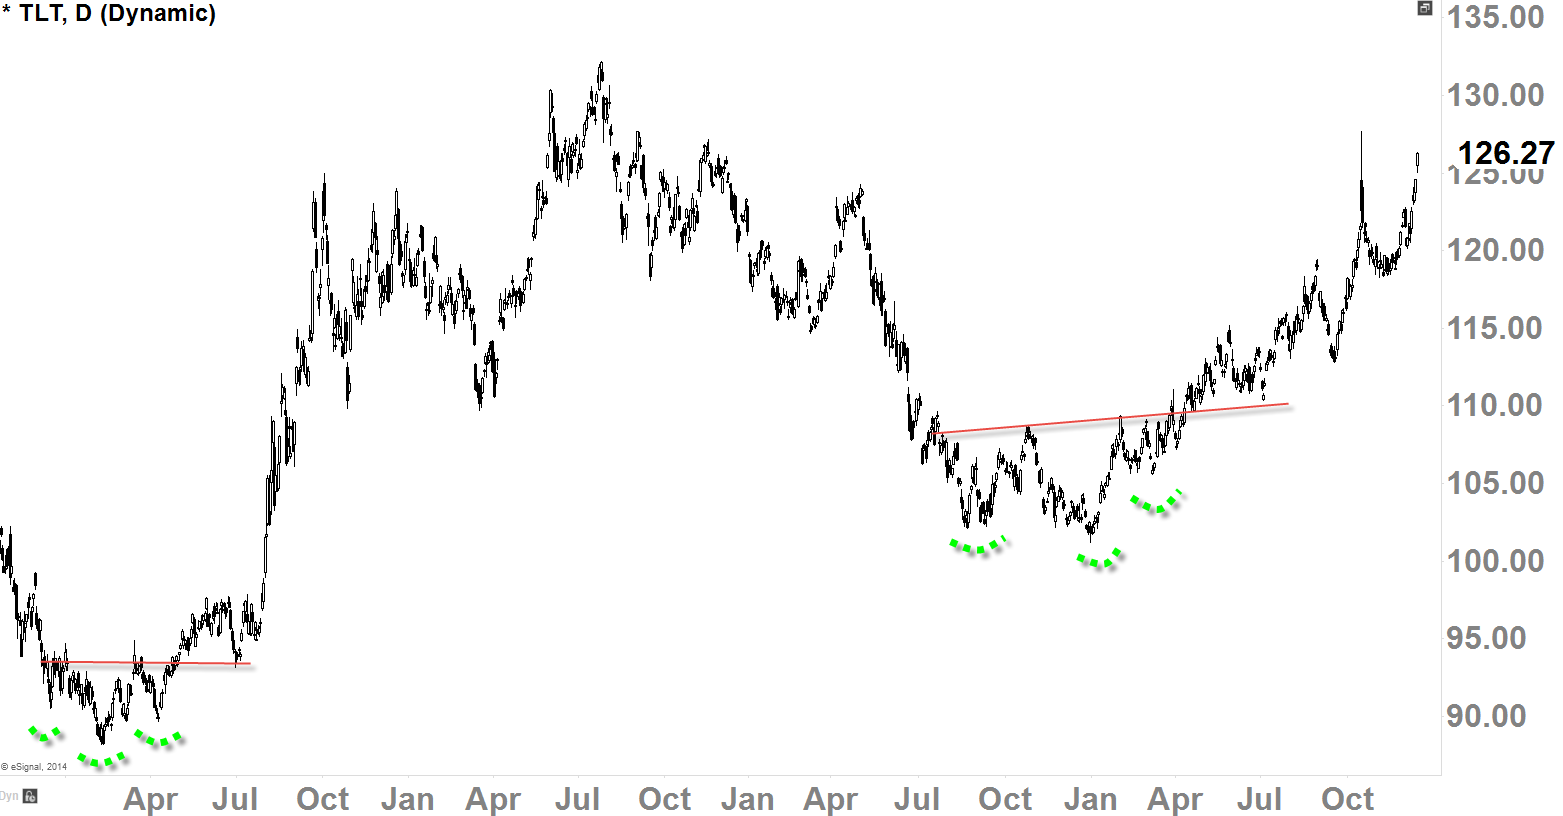
Back in mid July, broken above this downtrend resistance.
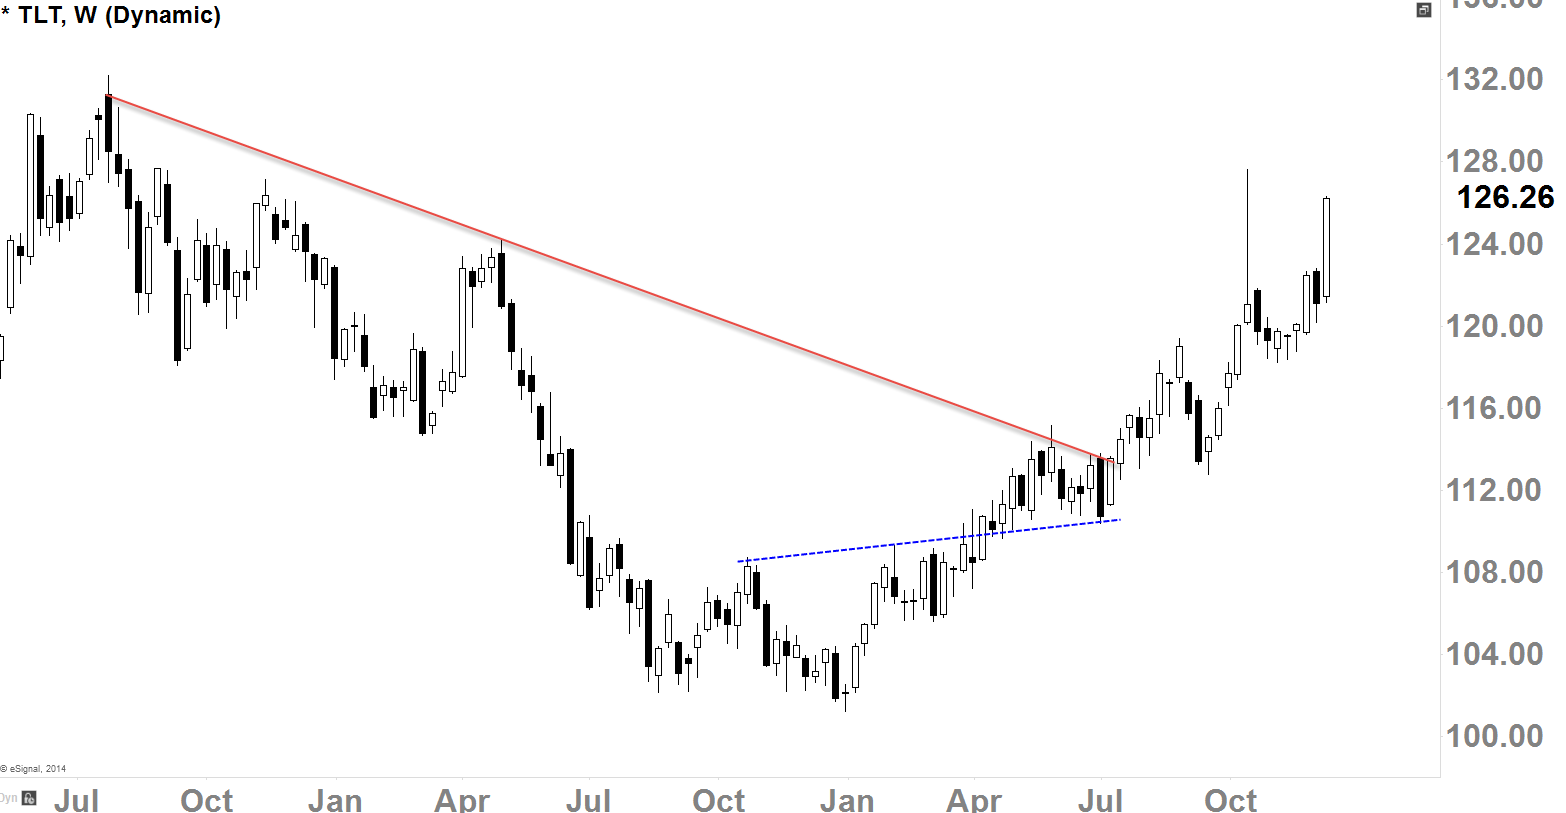
That’s a strong bullish candle this week as it has nullified that long-wick ‘shooting star’ candle warning-signal we’ve formed in mid-October. Looking at the weekly chart, I believe we can continue to grind higher with some daily fluctuations. Since we’ve broken above downtrend resistance back in mid-July, uptrend is still strong with well-defined higher lows and higher highs.
Monthly Action
[$TLT Monthly Charts]
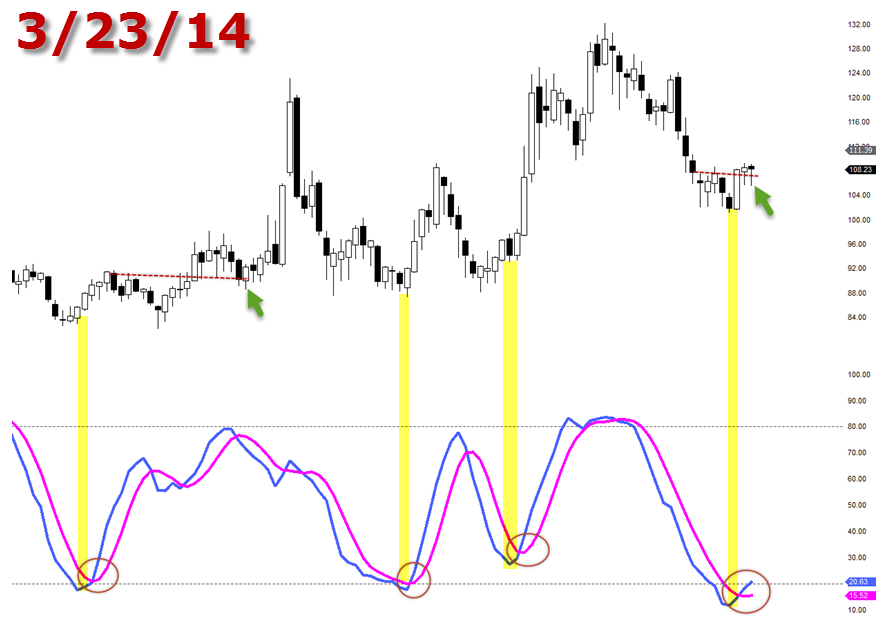
Long-term analysis using the monthly-chart indicator as we had that potential “buying” signal with the indicator’s cross back in late March. The price action (see the arrows) was also giving us some good signals as it was staying above the recent pivot after a bullish engulfing monthly-candle.
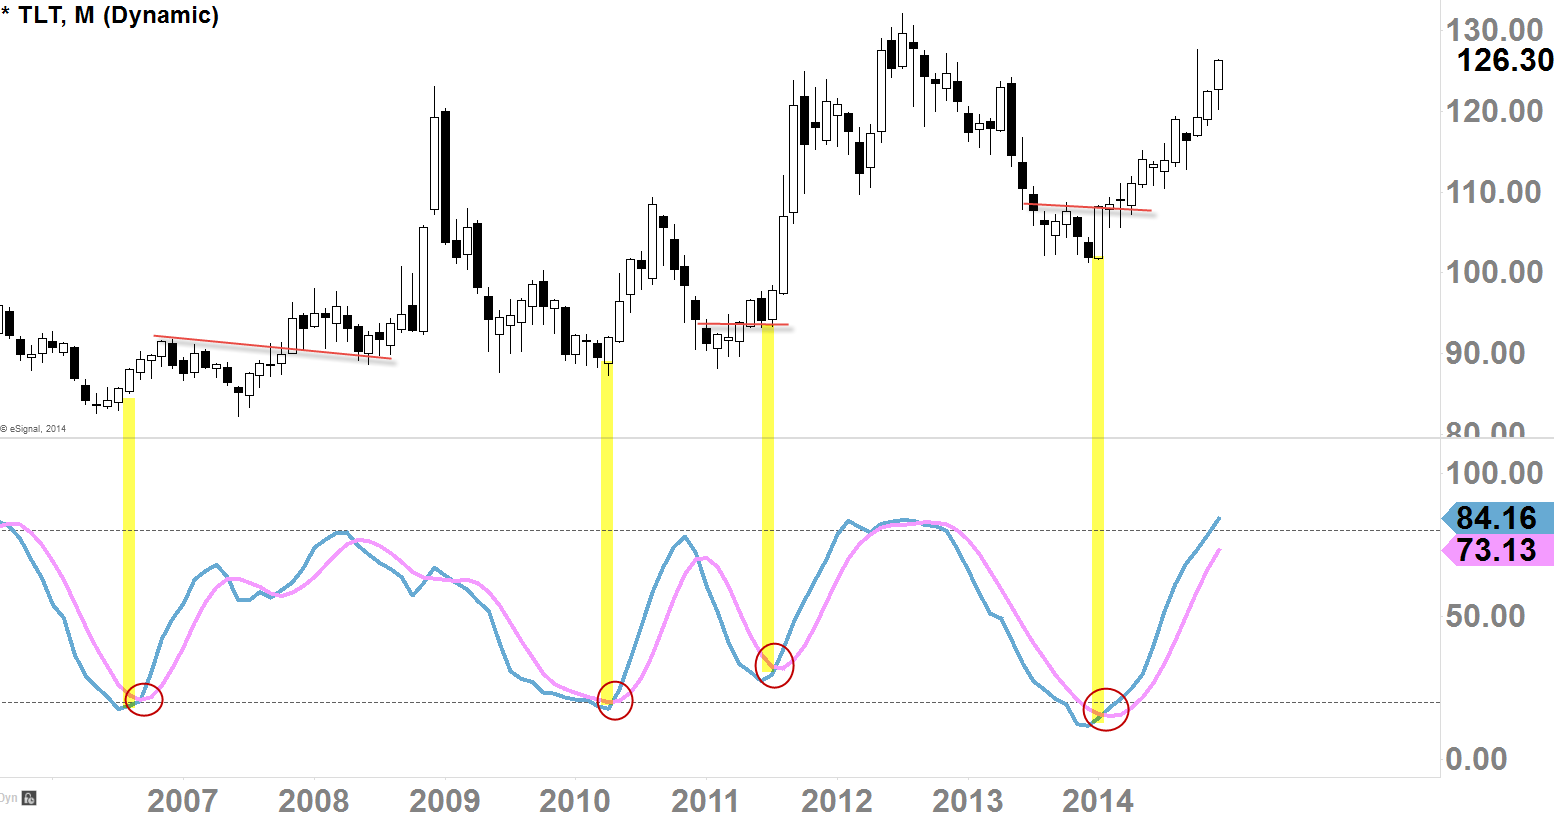
Since the late March, we didn’t even have a pullback on this monthly chart. Today the monthly-stochastic is getting to “overbought” status, but this does not mean it can’t go higher or it must roll over; it means possibly pullback is on it’s way, but this being a monthly chart, it could take up to 2-3 months before we can actually see some tangible signs. This monthly indicator is not useful for forecasting the rest of this month.
Ultimate Targets
[$TLT Weekly Chart – Screened on 8/16/14]
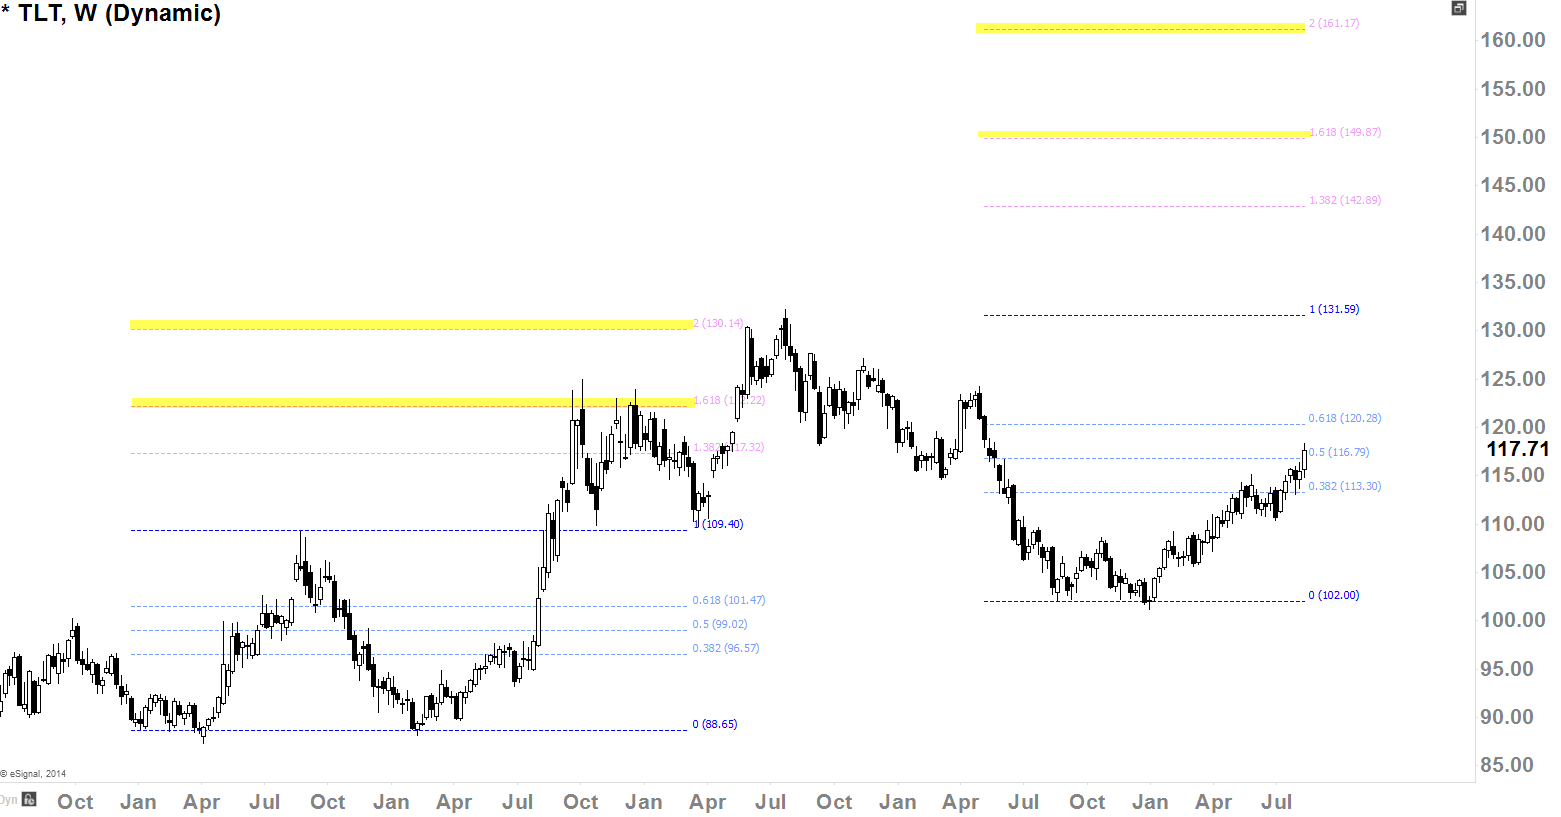
This weekly-chart was screened on 8/16/14 so currently we are trading well above the Fibonacci Retracement Zone which is a good sign in a long-term basis. I am still considering the fact that the Treasury Bond can possibly reach $145ish to $160ish if the equities were to have it’s true-correctional move. It has been extraordinary to see the Treasury Bond continue to move higher with the equity indices also continued to move higher (usually they have inverse relationship), but I still think soon or later, they will diverge.
Next resistance levels I see: $127.50 and $132ish which is our next target
Next support levels I see: $122ish and daily 100SMA
Final Thoughts
I love position trading because you don’t have to worry about intraday volatility and daily fluctuations as long as you can able to determine it’s intermediate and primary-term uptrend. Once the primary-term uptrend is well established, it takes a while for that trend to be broken (we’ve seen that on the equities last several years) so we can able to take advantage of that fact. I don’t think Treasury Bond’s uptrend will last as long as the equity indices, but I think it could continue until next year as long it does not create major-topping pattern and continues to cultivate higher lows and higher highs in the primary-term. We are still holding all of our positions as of today, and we have plan (as of today) to hold until our next target of $132ish.


