10/10 Wednesday
– Entered Bearish @ $610.53
(1:04 pm CT update)

-I like it because of that strong downtrend resistance that has been slicing this thing for the last 6 months.
I got triggered bearish earlier today just below the double top neckline. Double top is little hard to see but if you look at closely last 3 weeks, you can see that we have leaning double top that downtrend resistance. And the neckline has been broken today.
-Target is at $575. $560 would be a bottom of this short-term bearish trade but I don’t want it to fizzle around on that gap support which they usually do. Gap pivots are like a ‘wild card’, you never know what they can do. At times they can be very very solid support but sometimes they blow right through it. So It’s about $15 difference from $575 to $560 and I don’t want to squeeze out of it.
-We have lots of bearish reversal candle formations which I have not identified on the chart there. But we got bearish darkcloud cover 4 days ago, bearish engulfing yesterday and we might be forming a three black crows if we have another long bearish day tomorrow.

-I like the fact that we are trading below all moving averages.
Did you know many fund managers look at the moving averages? This is how the most of them trade. When the stock trades below long term moving averages, they go bearish. And when they trade above long term moving averages, they go bullish. It’s true.

-I like Bollinger Bands squeeze play. We had good boillinger squeeze back in January and this thing took off (that was over $200 move after the bollinger squeeze!). And today we are having another squeeze which that could possibly break strongly to the downside.
-One of my favorite indicator is ADX (the indicator in the middle row with red). It is strength and momentum indicator. As you can see as $PCLN trading upwards, ADX started going downwards. That was a indication that $PCLN was losing steam/strength in the trend. If this thing continue to trade downside, ADX will turn up thus giving us the sign that we are finding some momentum in this bearish trade. Currently ADX don’t think we have anything going here.
10/11 Thursday – Tanking..
(10:02 am CT update)

Very very nice this morning. Glad I got in yesterday.
We are seeing a Three Black Crows formation. Here is one thing I don’t like about three black crows. Because of their move is so fast and hard, often retracement or pull back is imminent which means tomorrow, we might see some bullish bounce. NOT a reversal but just some pull back or a rest pattern. So I wouldn’t be surprised if we slow down tomorrow.
My target of $575 coming pretty close. I could pull out today but I think I might wait few days and try to extract little bit more out of it. Nice trade if you are in this bearish.
10/12 Friday – Fib. Retracement Zone
(9:43 am CT update)

Well looking at my Fib. Retracement Zone (blue box), I might change my mind and hold through the weekend and see if I can squeeze some more out of this bearish trade.
I mean yea the day is still young so we do not know what’s going to happened until the market close but just looking at this right now, we can see that the Fib. 61.8% retracement level is starting to break.
If we close below that level today, it is likely we are going to hit the $565 mark. You ask me. What is Retracement Zone? Well basically that’s the zone that $PCLN could bounce off of and go bullish. Using Fib. tool, I could accurately pin point the possible retracement level so anywhere in the blue box, it’s possible that $PCLN could reverse and go bearish. However in the event that $PCLN trades below Fib. 61.8% level (just like it’s doing now), it’s confirming that $PCLN’s chance of bouncing (at least for the short-term) is pretty slim until hitting the major support which is $560 at this particular situation.
So looking at my fib analysis, I might not close my trade today and hold through next week. But if $PCLN is going to bounce, this is the place it’s going to do it so will see how it plays out through out today.
10/16 Tuesday – Bear Flag
(8:54 am CT)

We see this pattern quiet often after a huge rally like we had last week. Stock rose but volume declined. This is a classic sign for bearish continuation pattern.
If you look at your moving averages, 10EMA is also acting as resistance.
I think we should continue bearish tomorrow and my next target is at around $575 and then $560.
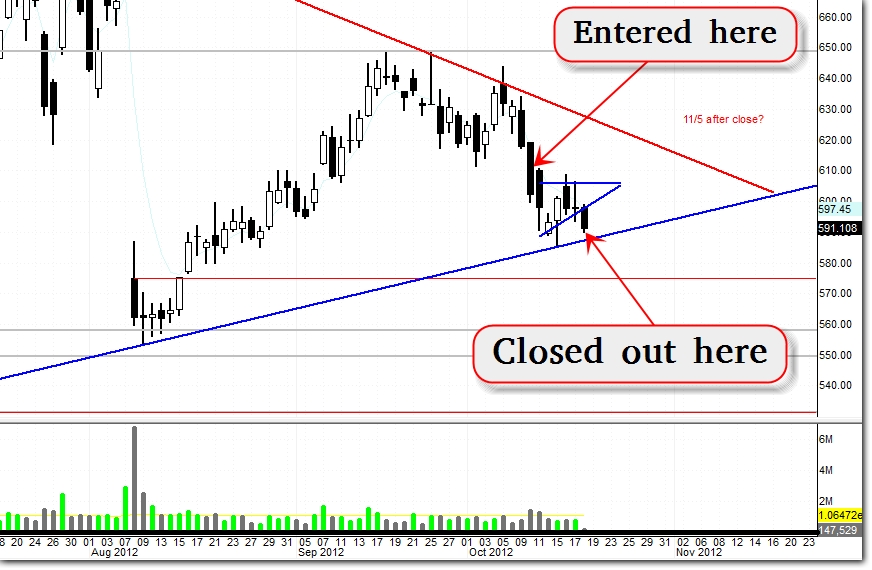
10/17 Wednesday – It Could Go Either Way

Ok how dumb of me now to spot this until early this morning. If I would’ve known this bullish trend line I probably closed out my bearish positions 4 days ago with good ROI. Anyway because of this two huge trend line (red = downtrend line, blue = uptrend line) this might continue bullish and wanting to go back up to that downtrend line resistance. We might be stuck on between two trend lines trading up and down while the range becomes narrower.

If we zoom in this is what we see. Looks to be a Pennant pattern. This pattern is usually a continuation pattern so in this case it would be bearish pennant. However since it’s forming right at our uptrend line, this could break on either side.
And maybe just tiny bit higher chances that it could break upside since we are the uptrend line support.
I did not get out of the trade but tightened my stop and hoping that it would break bearish. As soon as it breaks, I probably will close it out.
10/18 Thursday – Closed out my Positions @ 590.28
(9.37am CT)

Well my analysis tells me there is more bearishness ahead but I just don’t want to trade through that uptrend line from 12/15/11. That uptrend is pretty solid and I don’t want that battle. I’ve already battled this short-term pull back and got pretty tired from it =p Nice trade. Nice ROI though.


4 thoughts on “$PCLN – Why I Like this Short-term Bearish Trade (Update 10/18)”
Nice work.. if we get a bounce… how do u think it plays out based on the fibs ?
any bounce would be a good short imo..
hey thnx. yea we might bounce to 50% retracement level with some bearish continuation pattern such as a pennant, small wedge or bear flag. and then continue bearish. Still lots of bearish sentiment from up top and so weight is pretty heavy. However 61.8% retracement level must be broken before going bearish. In the event that we bounce from 61.8% and continue bullish with strong bullish reversal, we might go all the back up to that long term bearish trend resistance (bold red line)
PCLN tanknage. I can’t believe i got out yesterday for break even before that huge drop. I could’ve close out for 80% gain if i waited for 10 more mins. LOL. what a shame. I really have to get into a swing trade sentiment like u. Most of the trade work out well SINA, PLCN, QQQ, AAPL. Congrats on all your trade, u doing an excellent job bro. Do u have anything on right now or u book profit on all. Today was a good day to actually book all profit.
yea man i closed most of my trades today. I have $AAPL puts going now, $ORCL stll going (since like weeks ago i think) and got in bearish on $SLV and $GLD this morning which I am going to post an article on those two over the weekend.
I actuall closed my $PCLN last night too. If I would’ve waited until today I would’ve BANKED but you take profit early or on time, both alike is a good thing.