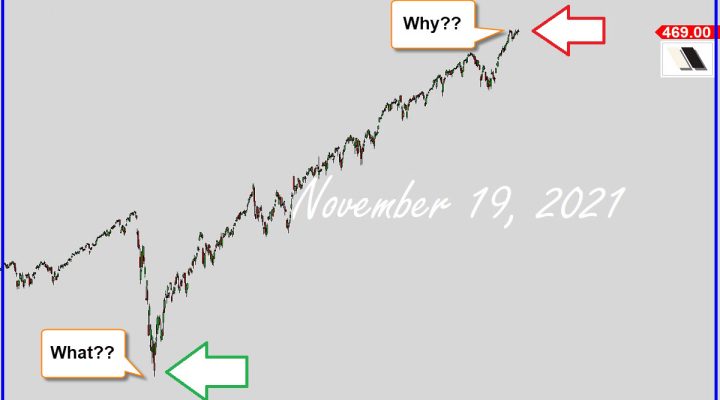
What Kind Of Shenanigan Is This!?
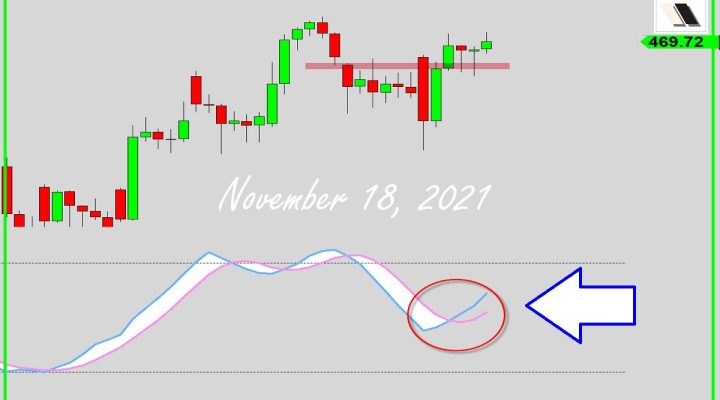
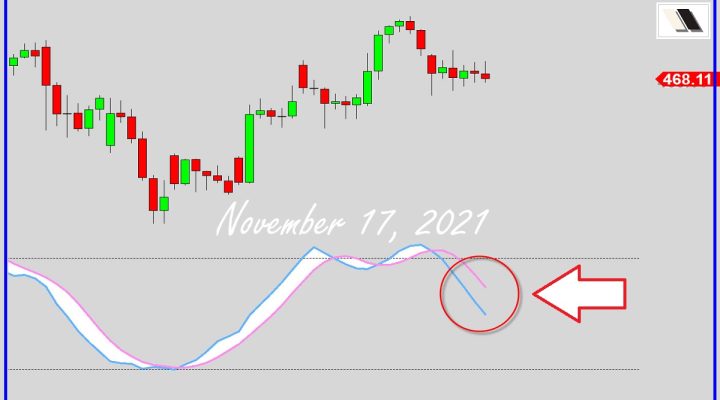
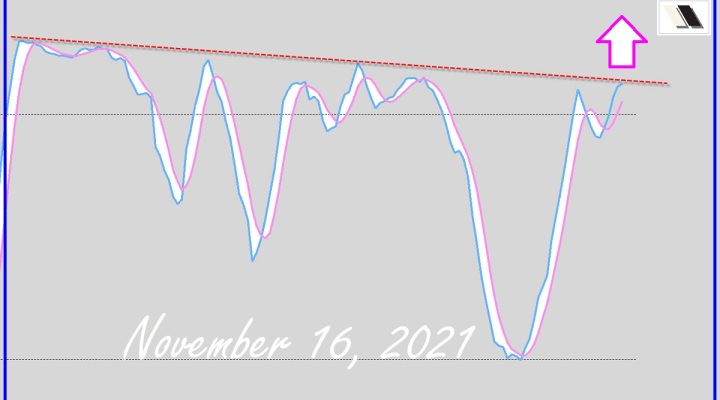
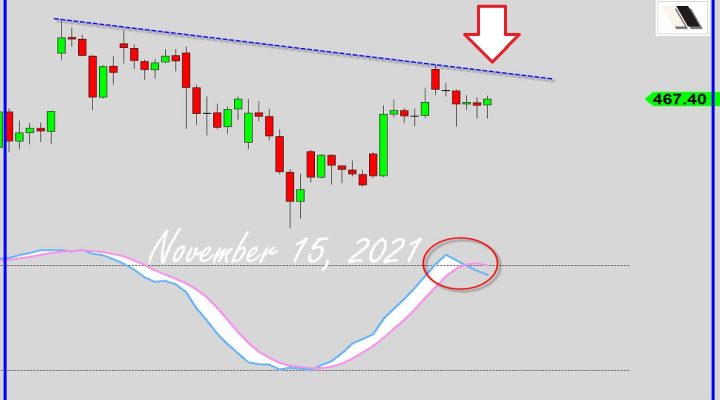
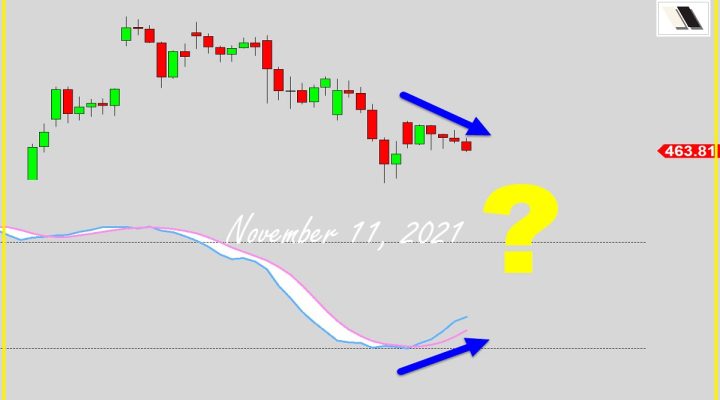
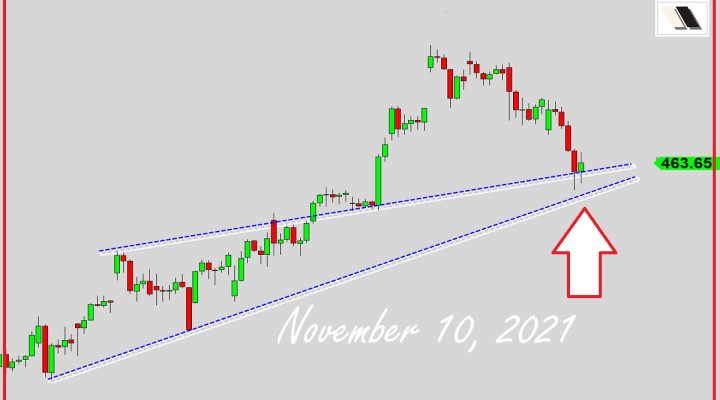
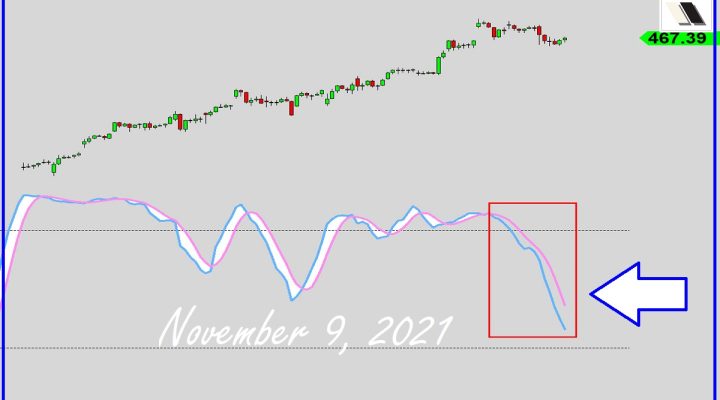
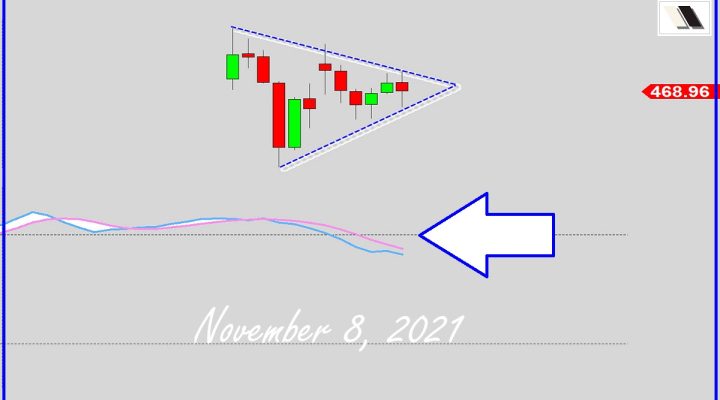
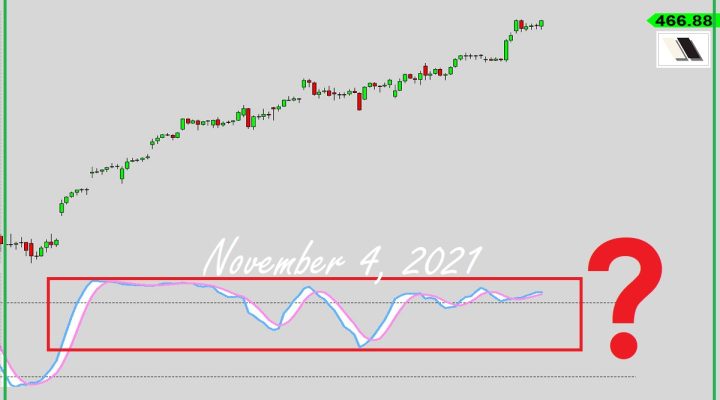
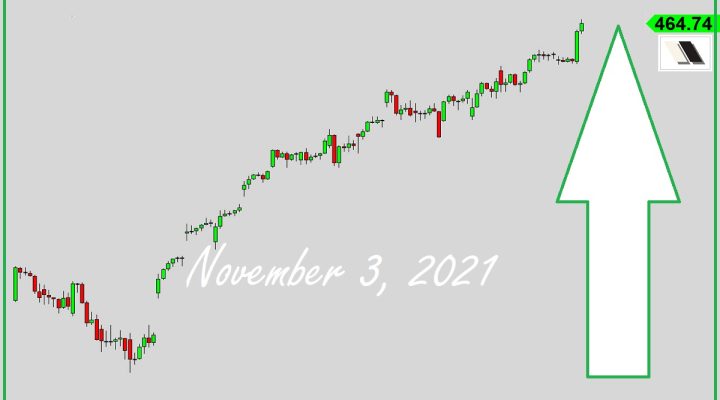
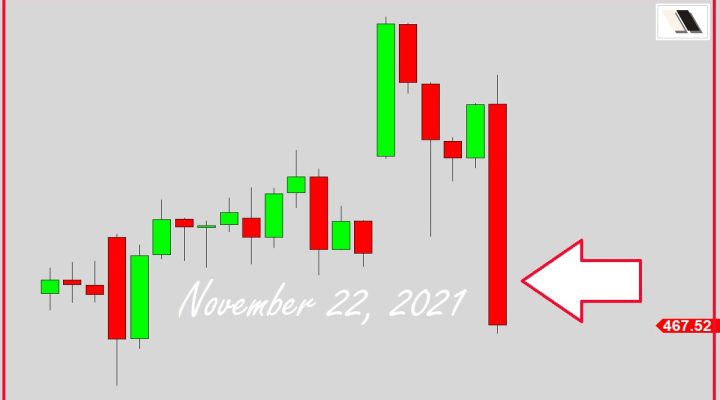
*Traders Club Membership Enrollment Opens In 2 Days @ https://2tradersclub.com S&P 500 ETF (SPY) Market Analysis (65min Chart): Is this market unstable? What happened in the price-action today with the big fluctuations and why? What can we expect this week
Read more →