
[divider]
1.13.13 Sunday
[divider]
Bullish Divergence in the Making
(Stoch, RSI, MACD, MFI)
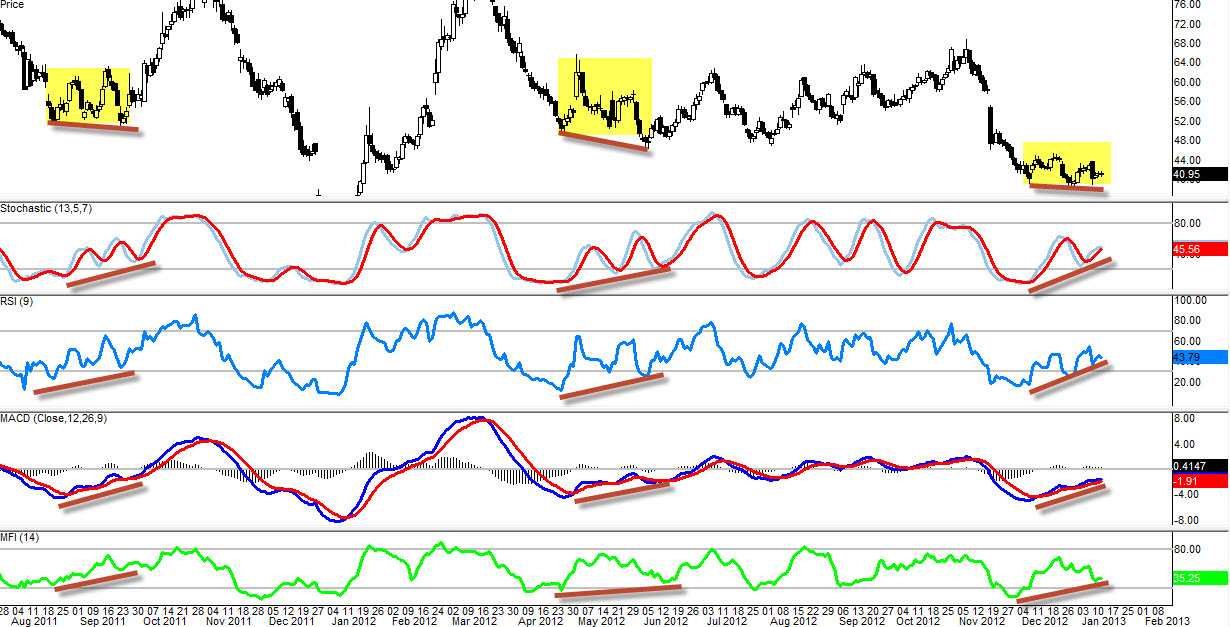
We could retest $39 level as support again this week before pop to the upside
Watch 20EMA
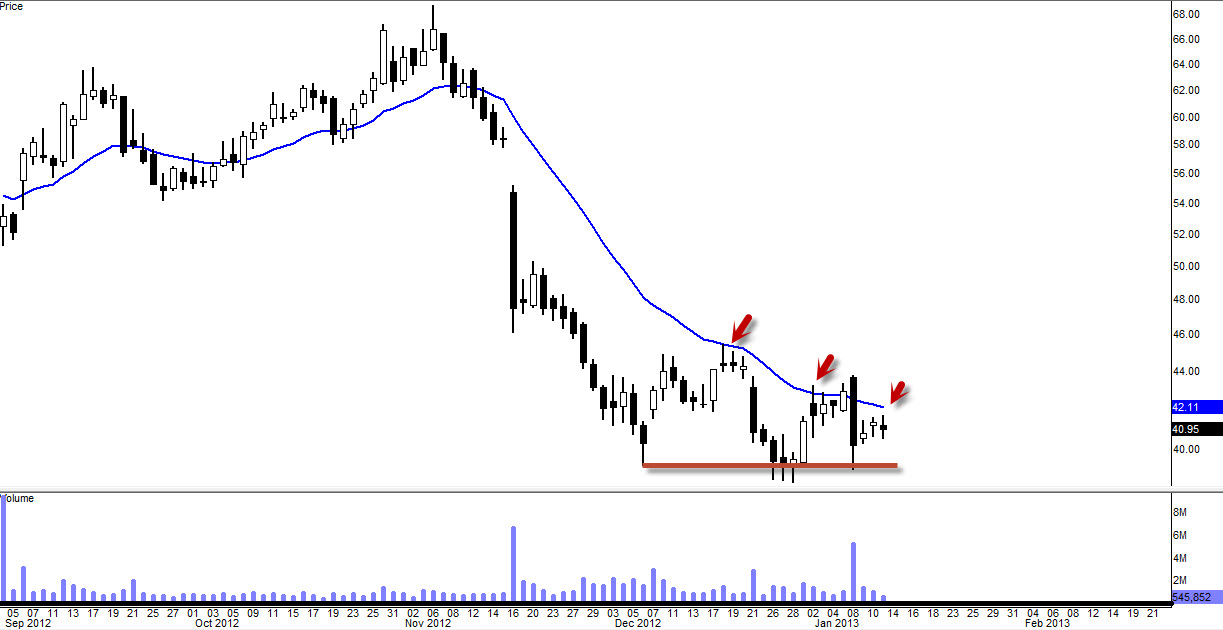
20EMA has been acting as strong resistance for about a month now so must close above that area to confirm some bullishness coming into this stock.
[divider]
1.14.13 Monday 9:41AM CT
[divider]
Entered Long Positions Earlier @ $42.56
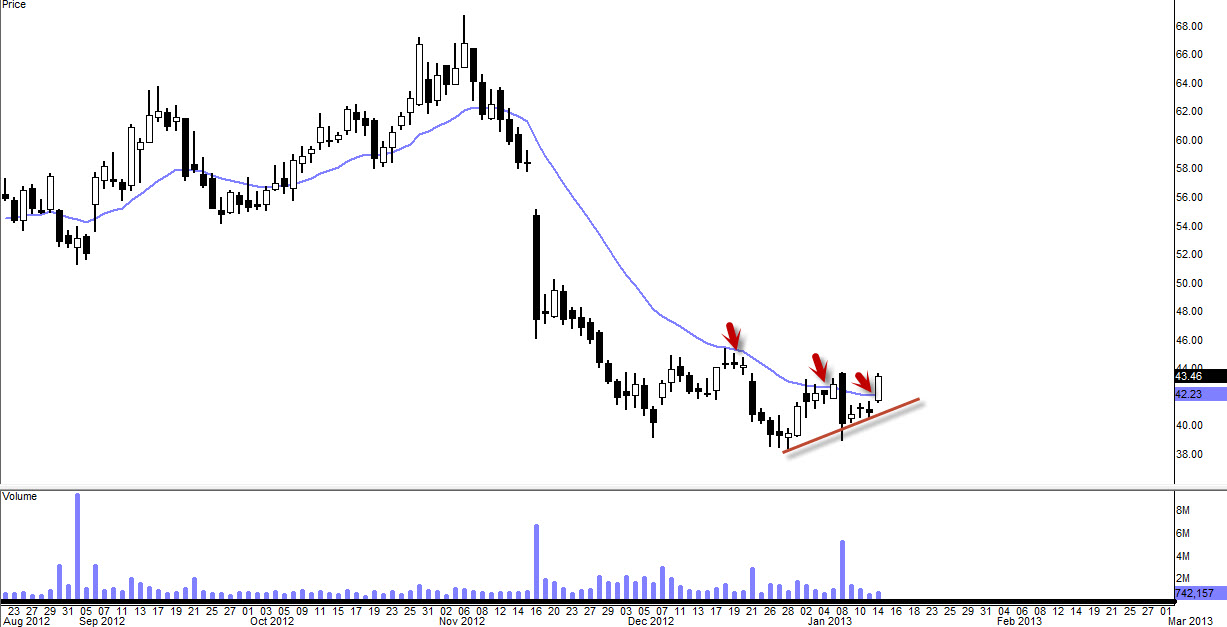
Currently trading above 20EMA. Closing above $42.60 will give some great leverage going into tomorrow.
[divider]
1.16.13 Wednesday
[divider]
Obstacles Ahead
(50EMA-Pink)
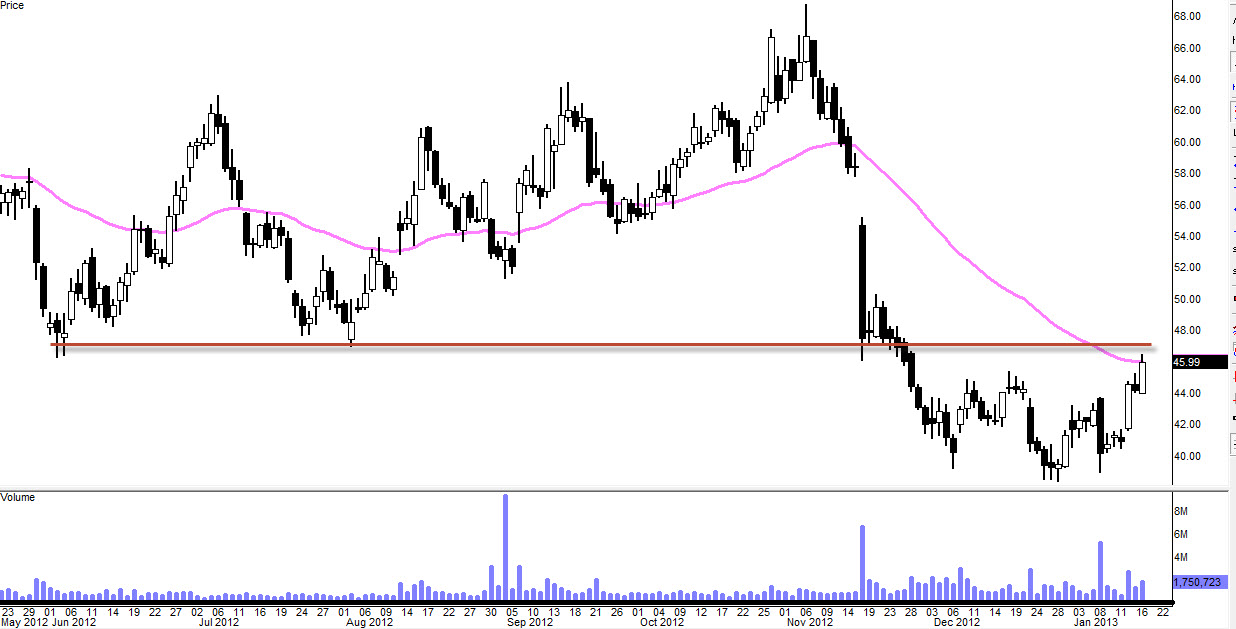
We’ve had nice upside move last three days however we are going to face yet another obstacle to overcome. This one isn’t going to be quiet easy as we have double confirmation of resistance.
- $47.30ish Pivot (old support becomes new resistance)
- 50EMA residing in that $47.30 vicinity
Few things could happen here tomorrow and Friday. We could see some retracement to gather some momentum to try again to break that resistance to the upside next week or we might just push through strongly tomorrow As of today, it is looking very strong but tomorrow is going to be a interesting day to see how $SHLD is going to react when it faces that pivot at $47.30ish (red line).
[divider]
1.18.13 Friday
[divider]
Still Holding Full Positions
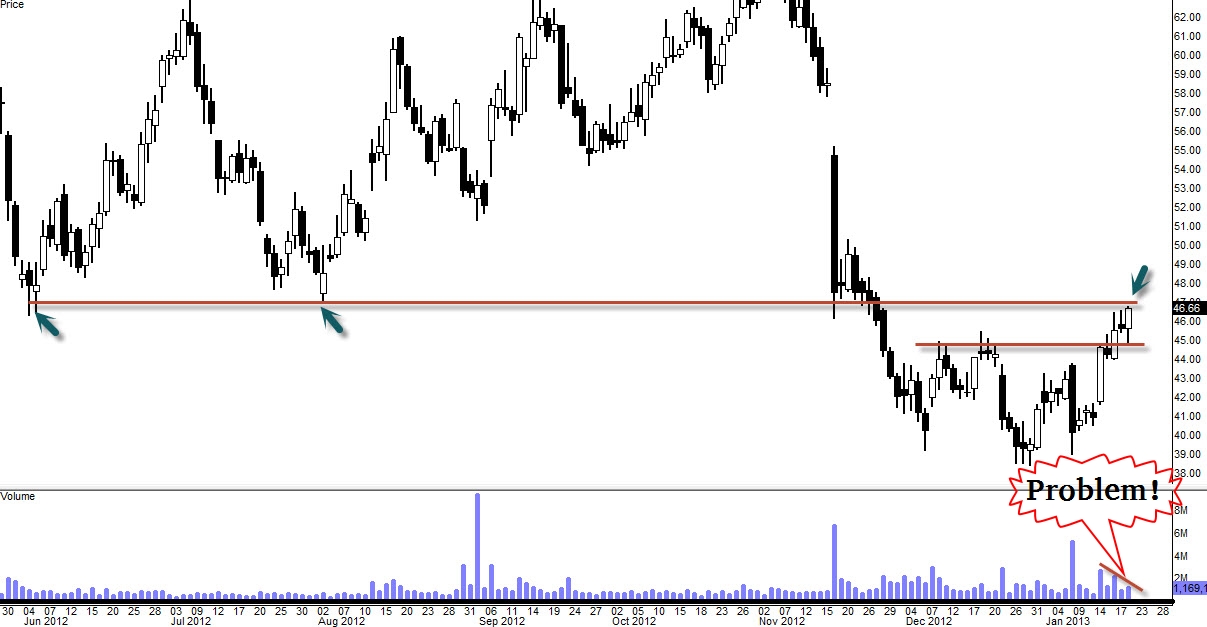
Technical 101 = “Old support becomes new resistance”
That’s where $SHLD stopped trading today just beneath the new resistance. We’ve had great 5 days of bullish run and that’s a good thing but we have a huge problem. Volume… Like I always like to say, “Stock rose, volume decreased, stock falls” and there is high probability of that happening because we are running into a strong resistance (old support). So going into Monday without any kind of fuel (volume) isn’t going to help. Either it needs to gap up thus just avoiding the contact with the resistance or two things going to happen. One, probably it will consolidate in that vicinity until it decides what it wants to do. Two, it’s going to roll over (My stop is just below 10EMA in-case it does). I will be watching closely intra-day on Monday.
[divider]
1.25.13 Friday
[divider]
GRINDING…
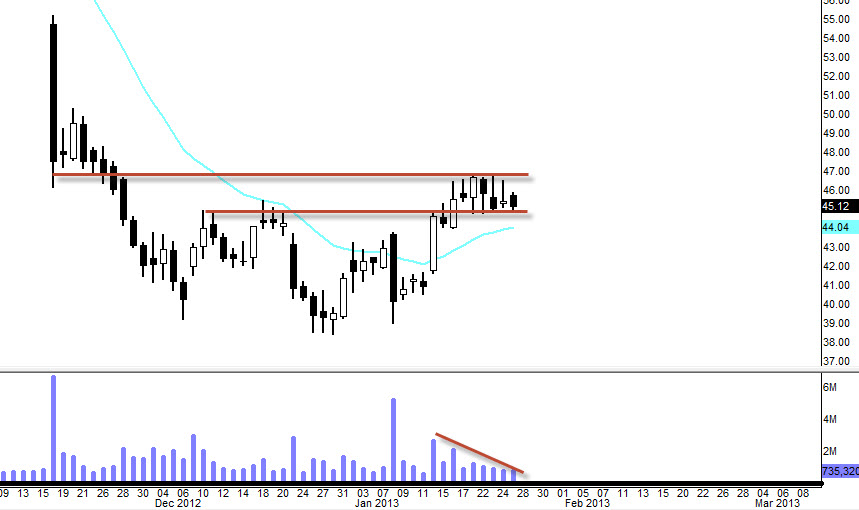
What do you make of this formation?
- Tight rectangle pattern
- Stair-step continuation
- Rolling over
- Nothing.. Just griding
I think all the above is correct answer. It’s really hard to pin point what formation it is but definitely there are some confusion of which way it wants to go. Break below 20EMA (green) would be bearish back down to the $39 vicinity or we break above current resistance of $47, would be bullish. I don’t know where it’s going but we shall find out next week. Still holding full bullish positions (tightened my stop though).
[divider]
1.28.13 Monday
[divider]
BROKE OUT
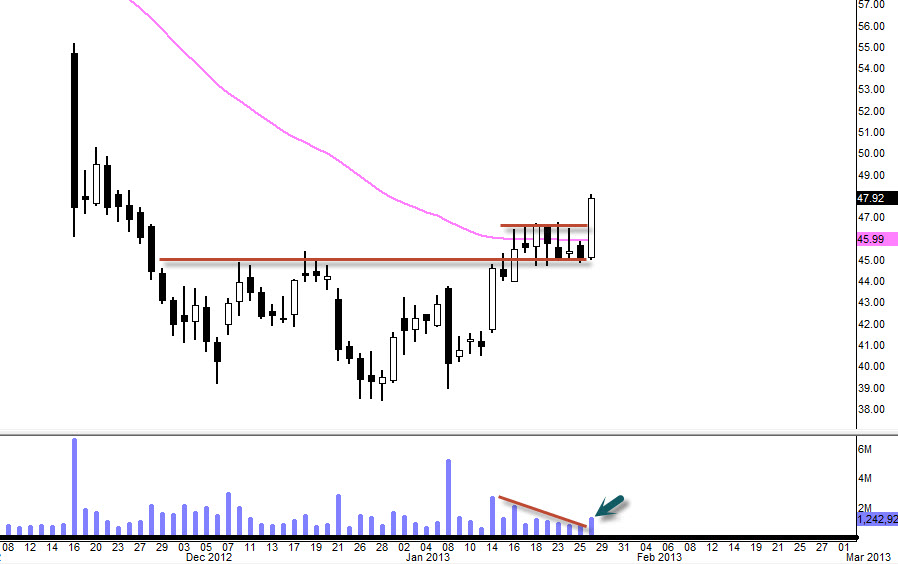
Well I guess the answer to my last question was that it was the stair-step continuation pattern but you know something about technical trading. It’s very similar to a basketball game. You shoot a fade-away impossible shot at the buzzer to save your team from losing and you miss it, you are a dork for pushing your luck. However if you make that impossible shot and your team ended up winning the game, you become a hero because you’ve made a tough shot and made the right decision. Funny right? Well to be honest, this $SHLD trade could’ve gone on either way. I just got a lucky break that it happened to go higher. But also keep that in mind that I did bet on the upside because ultimately I was betting on that track record of the bullish divergence that we have on this stock.
Volume is not impressive as I’d hoped to be and that’s a concern going into tomorrow. Hopefully we can get some follow through to the upside but I will be watching closely. Great move today nonetheless.
[divider]
1.30.13 Wednesday
[divider]
Still Holding Positions /Possible Bull Flag
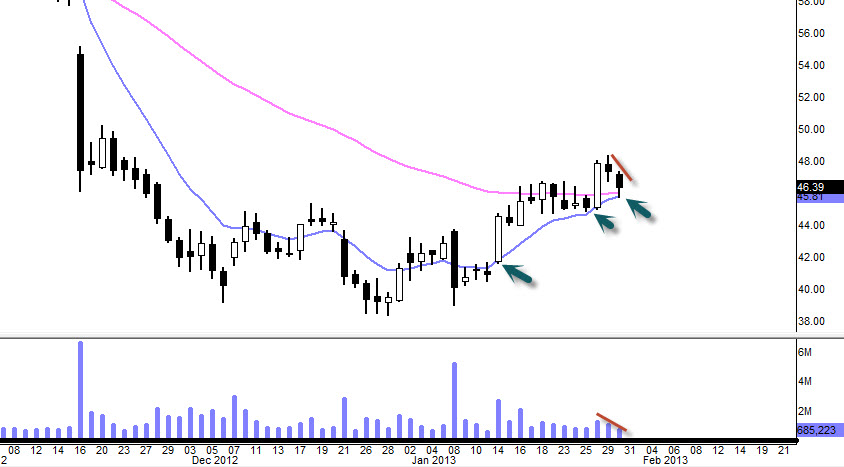
10EMA (blue) and 50EMA (pink) seems to be holding the bears so far and the volume has been decreasing continually which I do believe that possibly we are forming a bullish flag. If we close below 10EMA tomorrow, I do believe we are going further down. My stop has been tightened and let’s see how it plays out tomorrow.
[divider]
1.31.13 Thursday
[divider]
Added More Calls @ $46.26
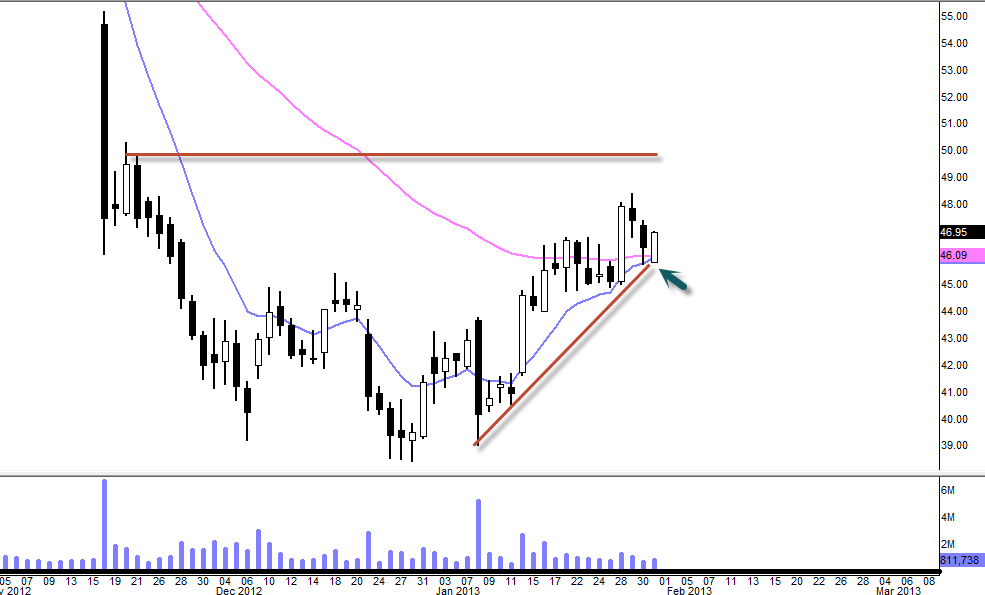
10EMA (blue) and 50EMA (pink) united along with recent uptrend support. This is very important when the stock meets 2-3 supports that could help them out and that was why I added more calls on Thursday morning when it cleared 50EMA (pink). Also my risk/reward ratio was great. My stop was just below 10 EMA so by adding more calls when it cleared 50EMA, I was only risking less than a dollar to make much more. It’s headed to $50 and that bull flag is playing out very well.
[divider]
2.3.13 Sunday
[divider]
10EMA and 50EMA Crossing
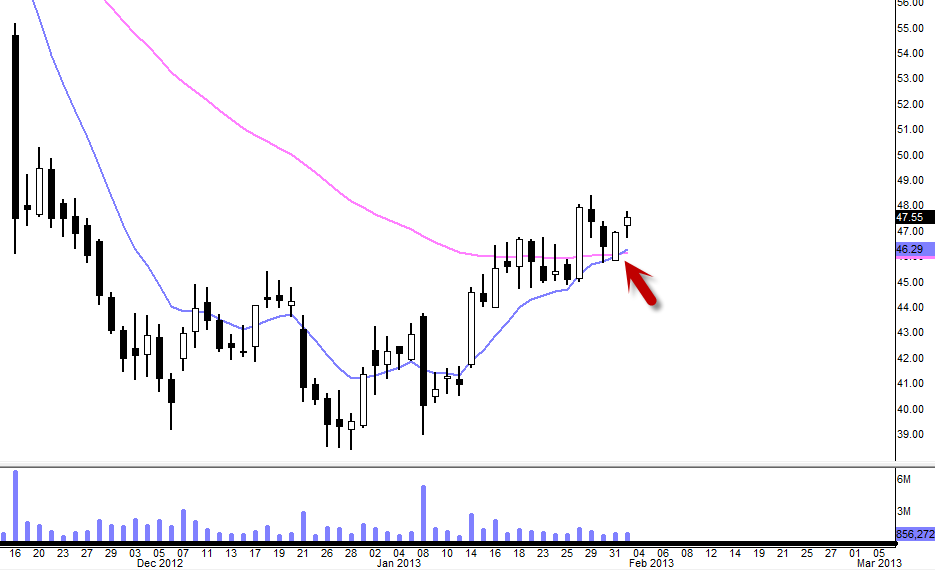
10EMA (blue) and 50EMA (pink) are just about to cross here. When they are fully crossed (by separating each other), it is indication of another bullish run. If you check your past daily chart, you can find that last 4 times when 10EMA crosses 50EMA, it turns into another bullish run. And that does not mean it has to play out but it does mean that it has high probability that it will.
[divider]
2.4.13 Monday
[divider]
Stopped Out @ $46.15 with Profit
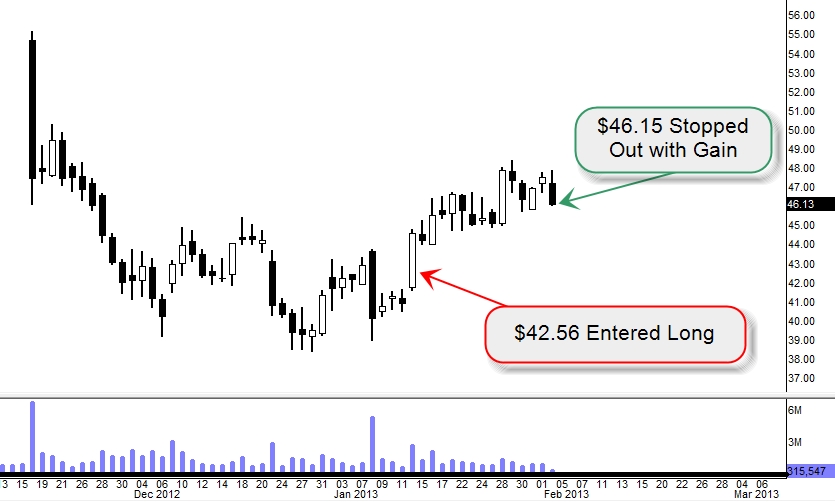
I thought I would able to get more out of this trade but still very good ROI. I have no plan to go long again as I see that the market is starting to retrace.