[divider]
Aug 2003-May 2004
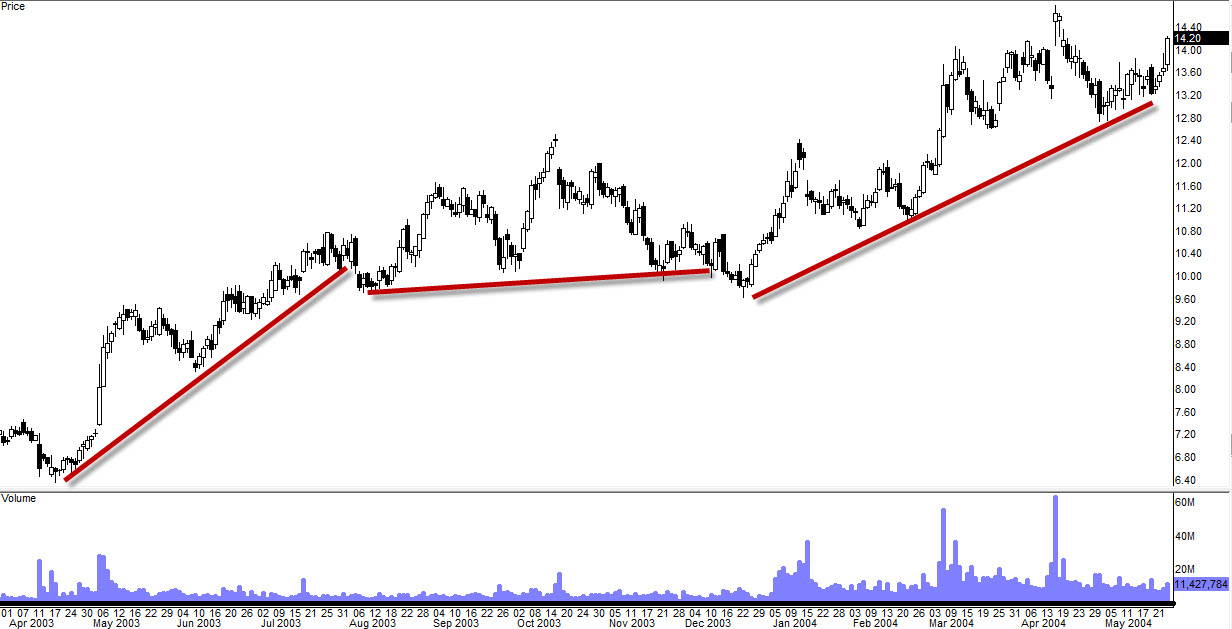
Uptrend lines, making higher lows = Bullish
Aug 2004-Aug 2005
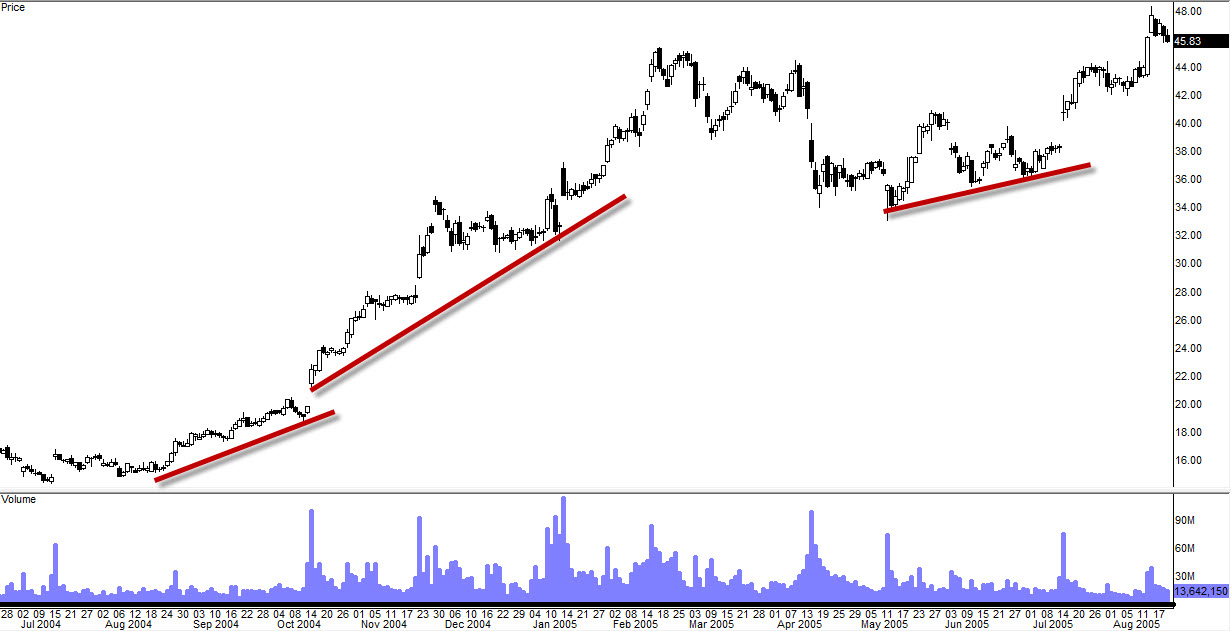
Uptrend lines, making higher lows = Bullish
Oct 2005
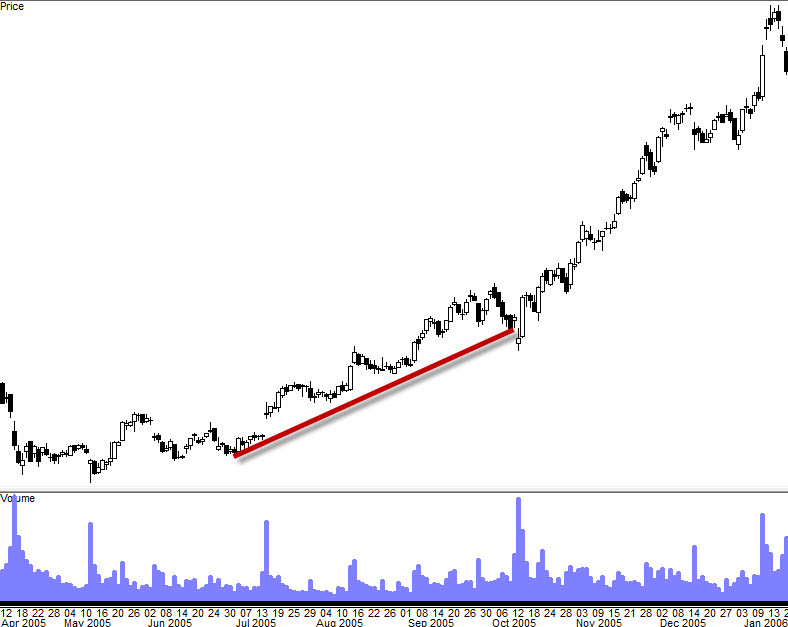
Established Uptrend line=Bullish
Oct 2006
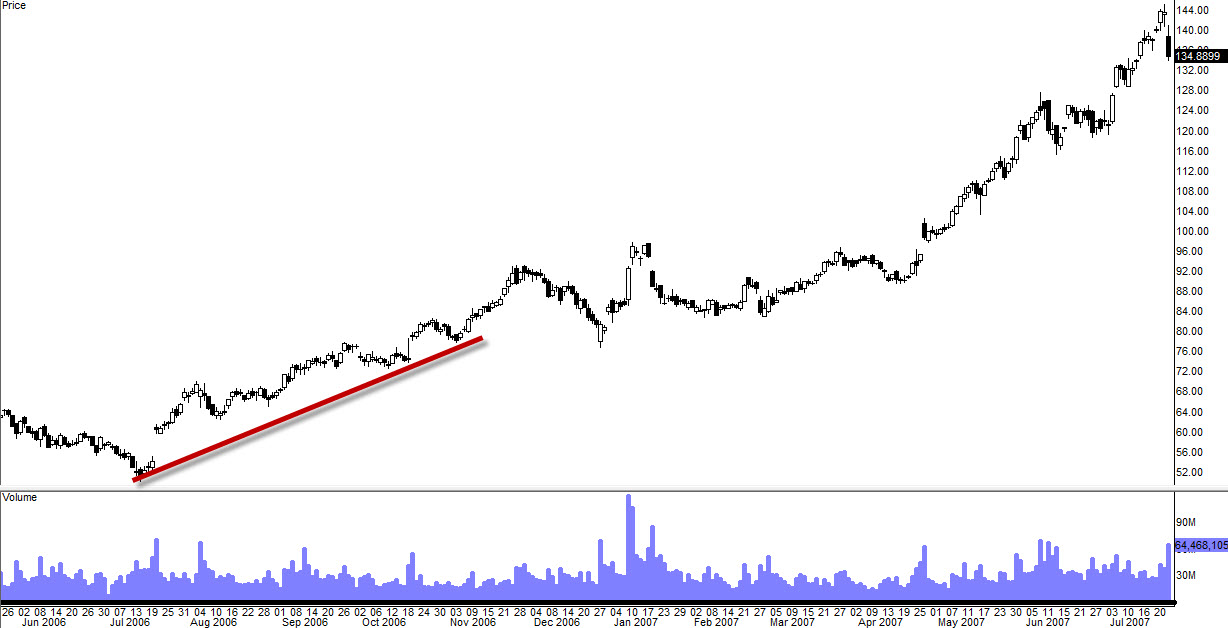
Uptrend line has started with higher lows=Bullish
July 2009
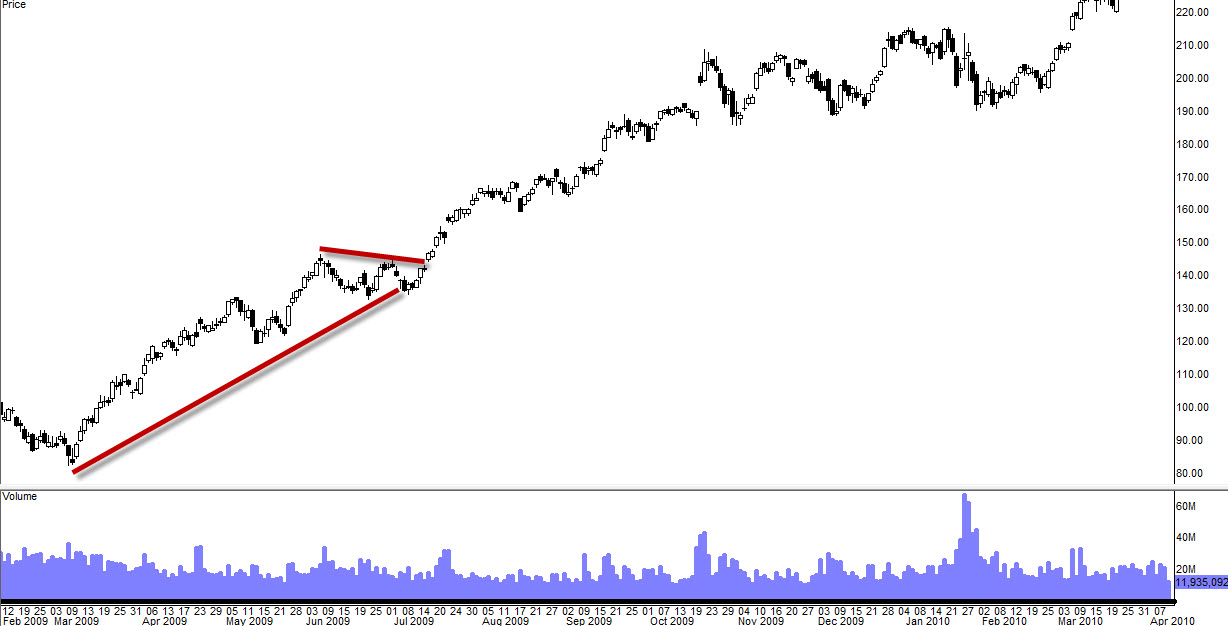
Nice rising wedge=Bullish, Uptrend line established=Bullish
December 2010
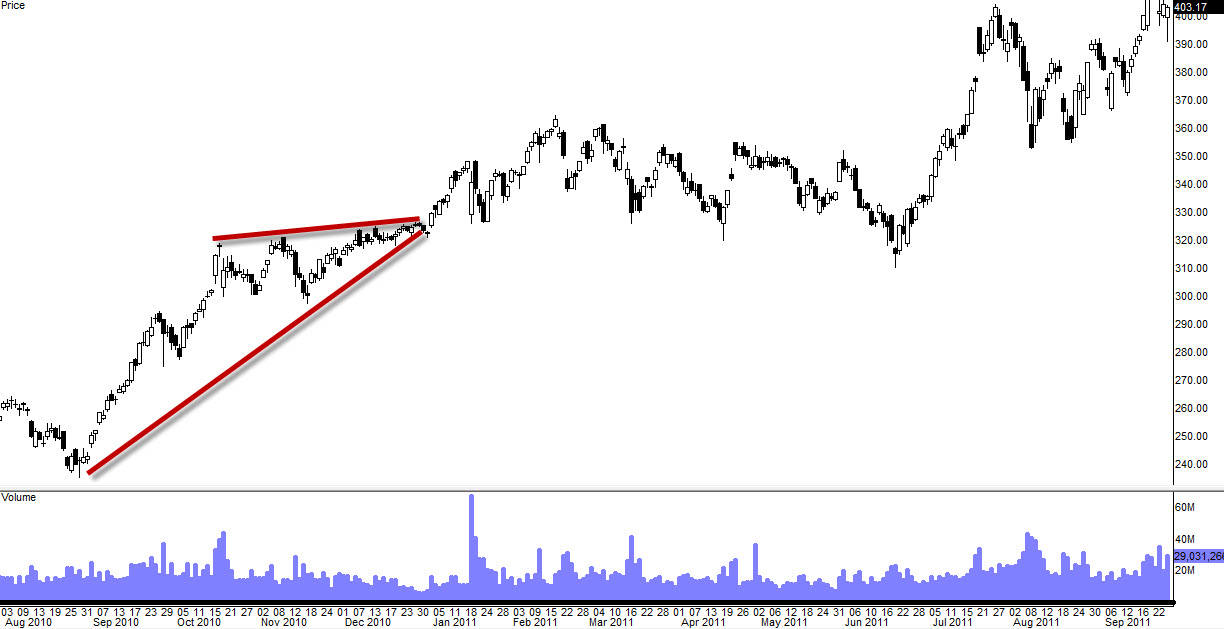
Nice ascending triangle=Bullish, uptrend line established=Bullish
November 2011
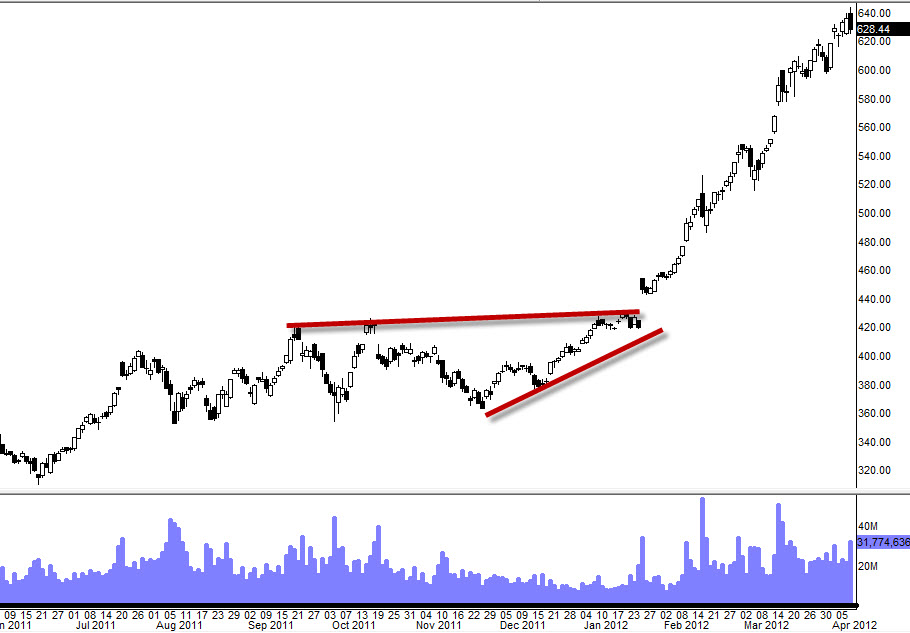
Nice ascending triangle=Bullish, Uptrend line with higher lows=Bullish
[divider]
[divider]
But When You See This…
Jan 2013
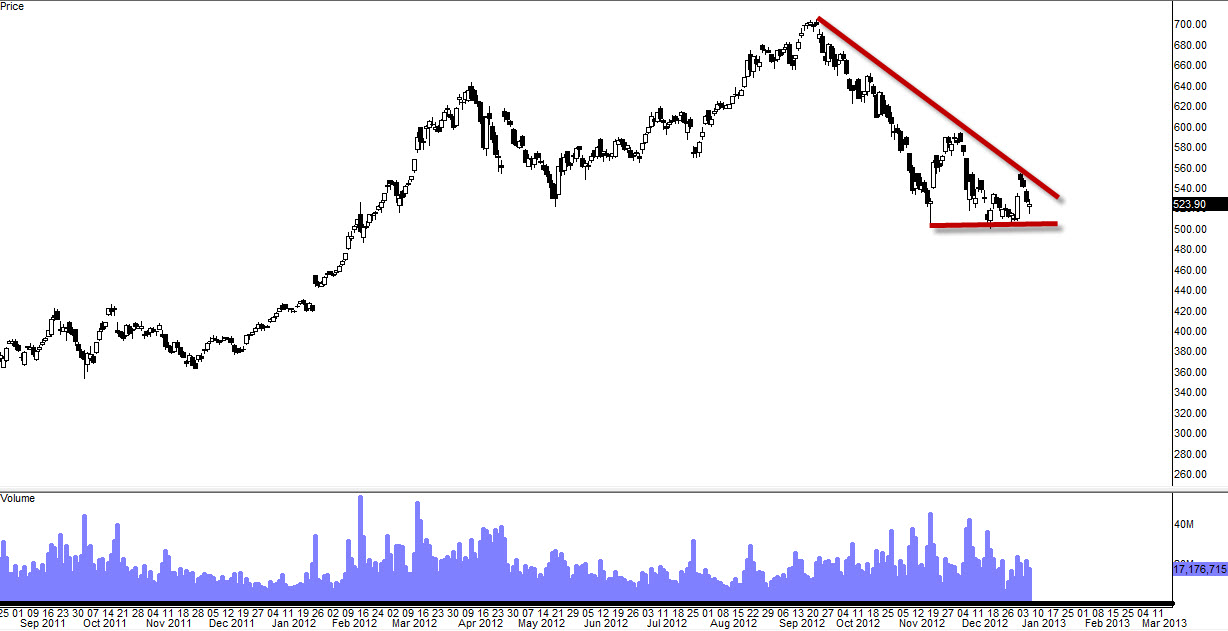
Nice descending triangle and downtrend line=Bullish??
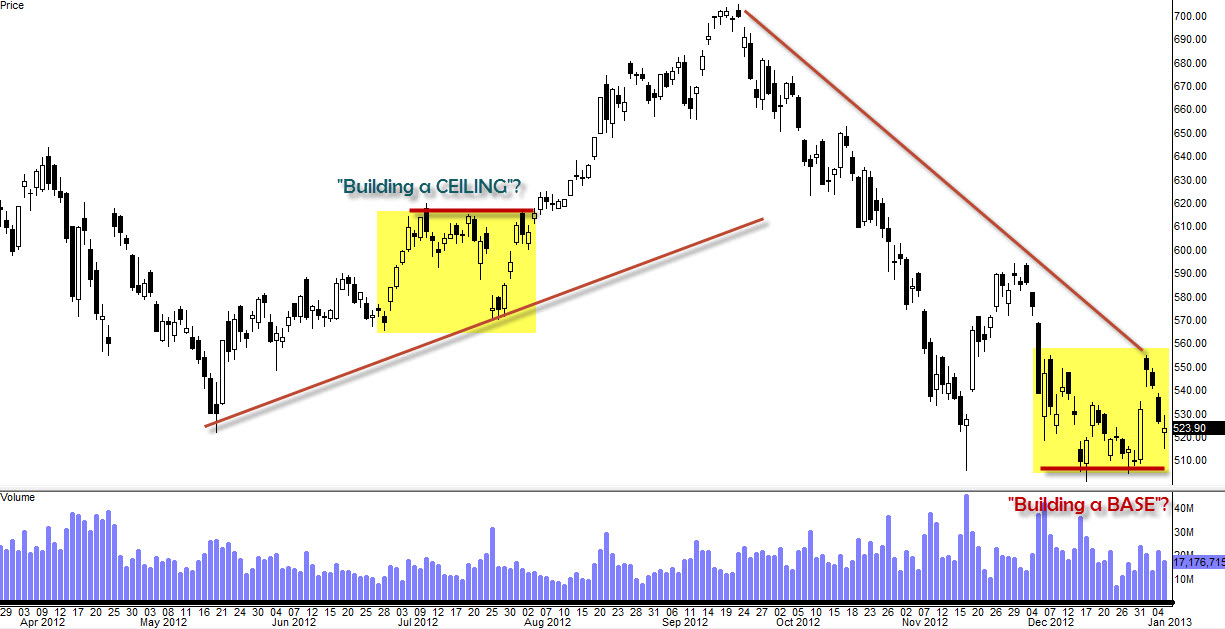
We are forming a base here=Bullish?
I am NOT saying you are wrong. You might be right and this stock might truly form a base here and rise. But if you say you are doing an unbiased analysis on this stock, it’s not true. You are BIASED $AAPL lover and think that stock has to always go up.
Isn’t it interesting that I never hear traders say “we are forming a ceiling to go down lower” when the scenario was completely opposite (as shown examples above). But today, many would say that we are forming a base on $AAPL to go up higher whereas we don’t ever hear about “forming a ceiling” analysis. It’s because traders think that stock always goes back up. Even though many claims to be unbiased in their analysis but the truth is most of them are.
That’s the problem with always being bullish on this stock and cult like followers of $AAPL. In technical analysis, there are always two sides of the coin and in ANY situation you can bring argument on both sides. There are always bullish sentiment you can argue in the midst of bearish trend and the converse is true. There are always bearish sentiment you can argue in the midst of bullish trend. But the true technical analyst does not lean on one side or the other just because they found some kind of technical reasons because if you are trying to find some dirt in the area where someone just swept, you will find some dirt. There will always be some dirt you can find.
Challenge is to make a decision depending on the given data and the facts to determine the higher probabilities of certain direction even though there will be legitimate argument for both directions. So traders most difficult task is not so much as to find out what formation it is or what reversal pattern that might be, but it is to make decision on a direction and trade on that direction he/she has chosen to trade. That’s the hardest part.
Let’s go back to $AAPL.
Based on two simple facts (Well established downtrend line (making lower highs), formed falling wedge/triangle formation), I am leaning more towards to bearish side and I don’t think we have much bullish argument here to be honest. It doesn’t mean I am right but it means it has higher probability that it will break lower. Upon break-ing out of this wedge pattern (breaking below $500) would cause $AAPL to go down lower with some momentum.
Building a Ceiling vs Building a Base?
Non-sense