Last Update: 1.14.13
[divider]
Related Articles
Article from 9/28/12 “10 Reasons of Why I am Extremely Bearish on $AAPL”
Article from 12/15/12 “Why I Believe $AAPL is Headed $360”
[divider]
1.1.13 Tuesday
[divider]
Watch 10EMA and 50EMA
(Daily Chart | 10EMA-Green, 50EMA-Pink)
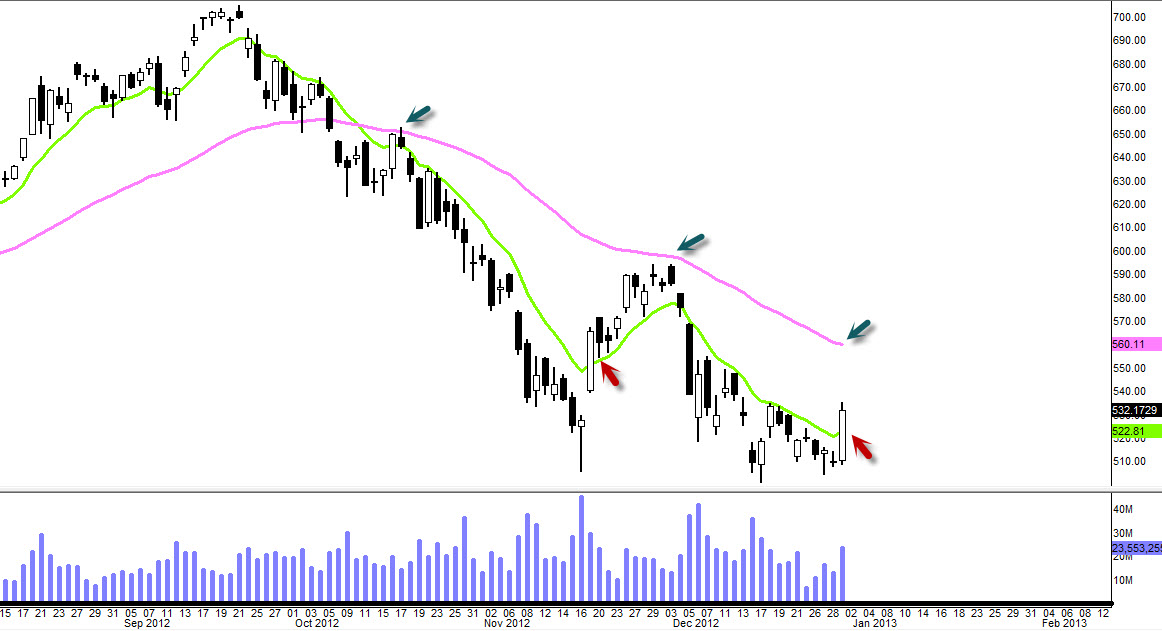
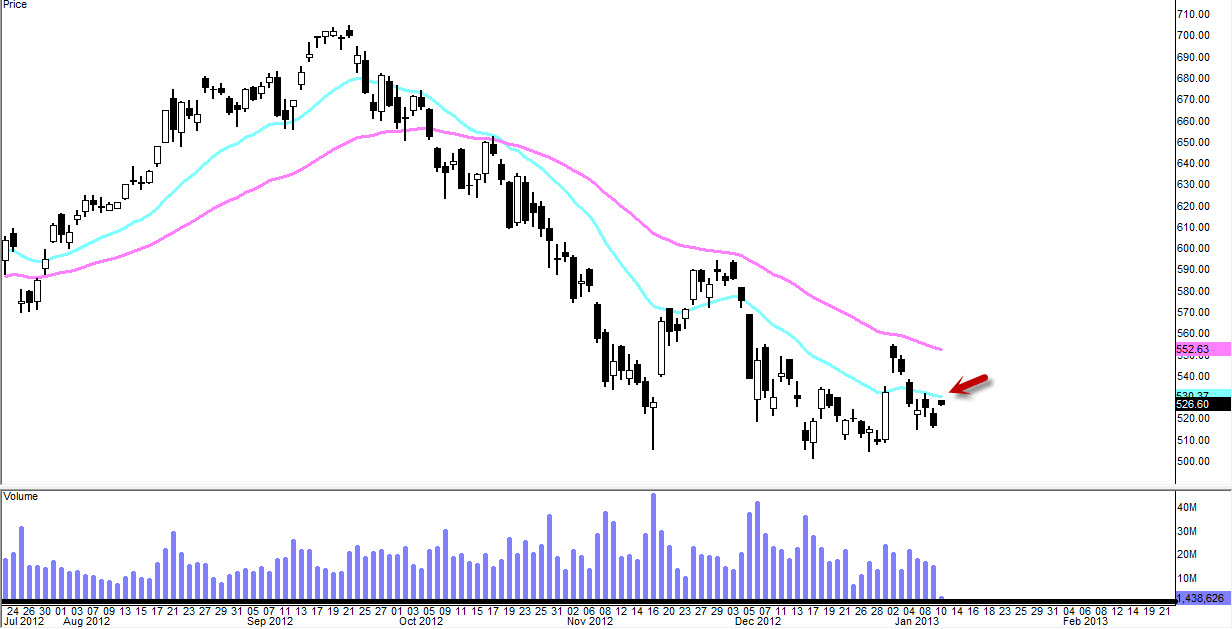
Yesterday we had huge break-out with good volume spike and I did not yet get in to long positions as I was not in the office at that moment so here is my short-term bullish trade setup. Many of you know that I do not chase after a trade if I missed a good entry. The best entry would’ve been just above 10EMA (green) yesterday and obviously I missed it so here is how I am going to play this tomorrow as I will be watching it closely intra day.
If we gap up tomorrow or it continues to rise higher without any kind of retracement (pull back), I will forget about this bullish trade all together. Only way to get me to jump in bullish tomorrow is IF or WHEN it retraces back down to retest that 10EMA area (see red arrow) which is $522ish just like it did back in November 20th. If it comes down to that level tomorrow, I will enter bullish.
Once I enter long position, my 1st target would be at around $560 (see blue arrow) where 50EMA is hanging around. Got to watch that area very closely as 50EMA has been served as pretty STRONG resistance last two times (see blue arrows).
If we break above $560, next target would be $590 which is the peak of the December 3rd. That level for sure will be a solid resistance because it rolled over back in December 3rd after hitting that price level and also 200SMA is residing just above that vicinity.
Bullish Divergence on the Oscillators
(Daily Chart | Stoch, RSI, MACD, MFI)
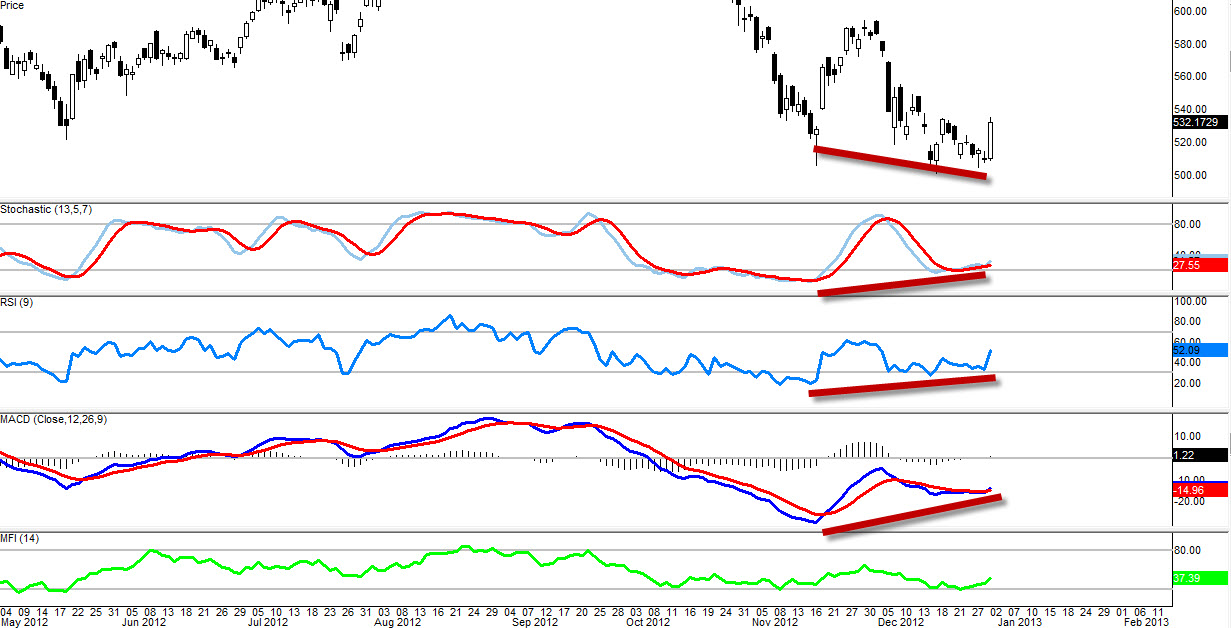
$AAPL acts very well to these Divergences. Remember the fall late September? Well we did have Bearish Divergence at $700 level and now we have the Bullish Divergence. High probability that it is going to play out but the question is how well and how long.
[divider]
1.2.13 Wednesday 10:15AM CT
[divider]
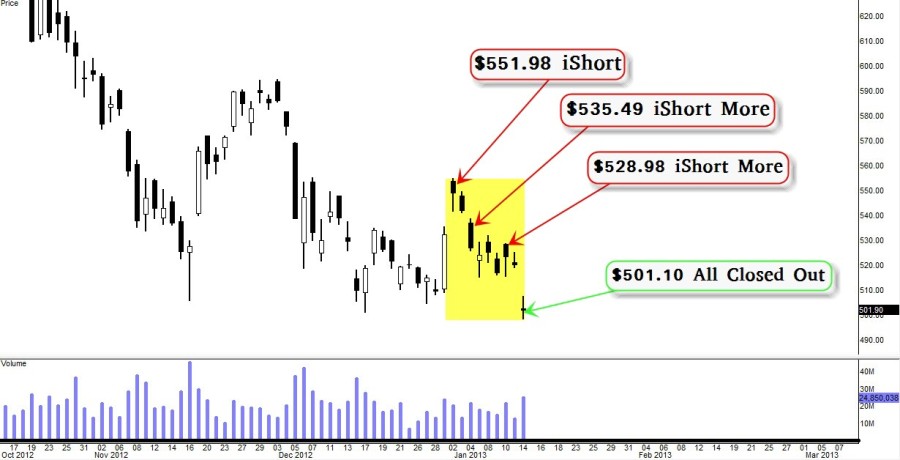
iShort (Puts) After Open @ $551.98
(Daily Chart | 10EMA-Green, 50EMA-Pink)
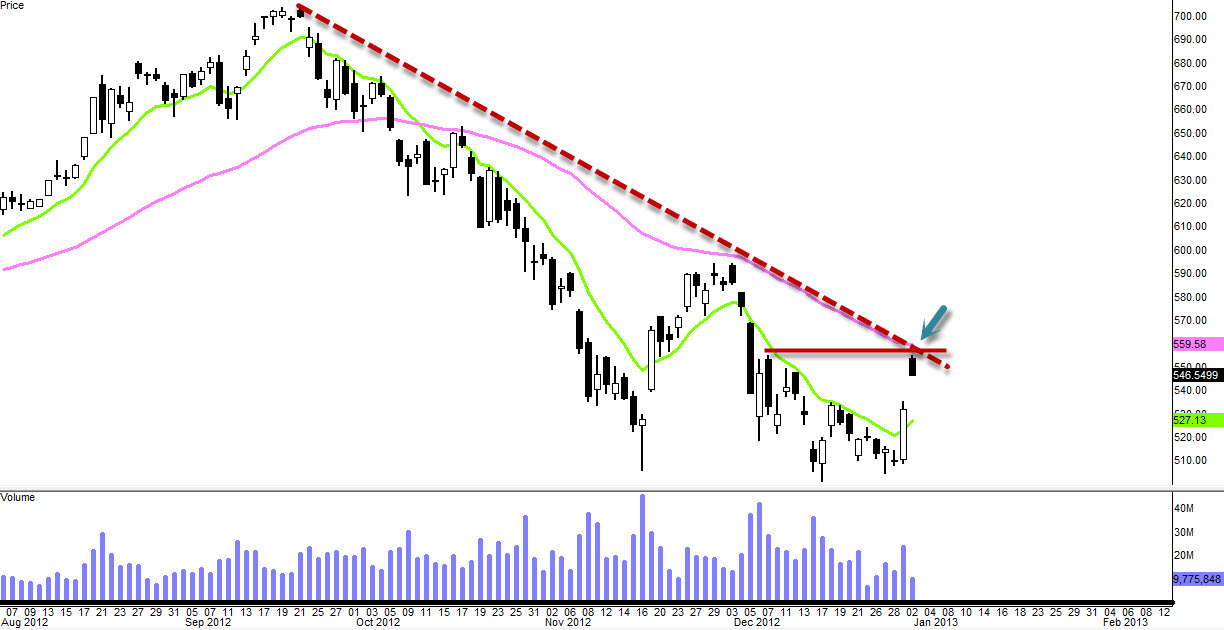
That long term downtrend resistance has not been established but it’s suspected resistance for now also that area is coinciding with horizontal recent resistance along with 50EMA all in-syncing in that vicinity so I decided to enter short just little bit after open this morning.
If we can fill the rest of the gap by EOD, that would signify huge bearish reversal formation for $AAPL. Will see.
[divider]
1.3.13 Thursday 12:41PM CT
[divider]
Still Holding Short, Long Trigger in Place
(Daily Chart, 200SMA)
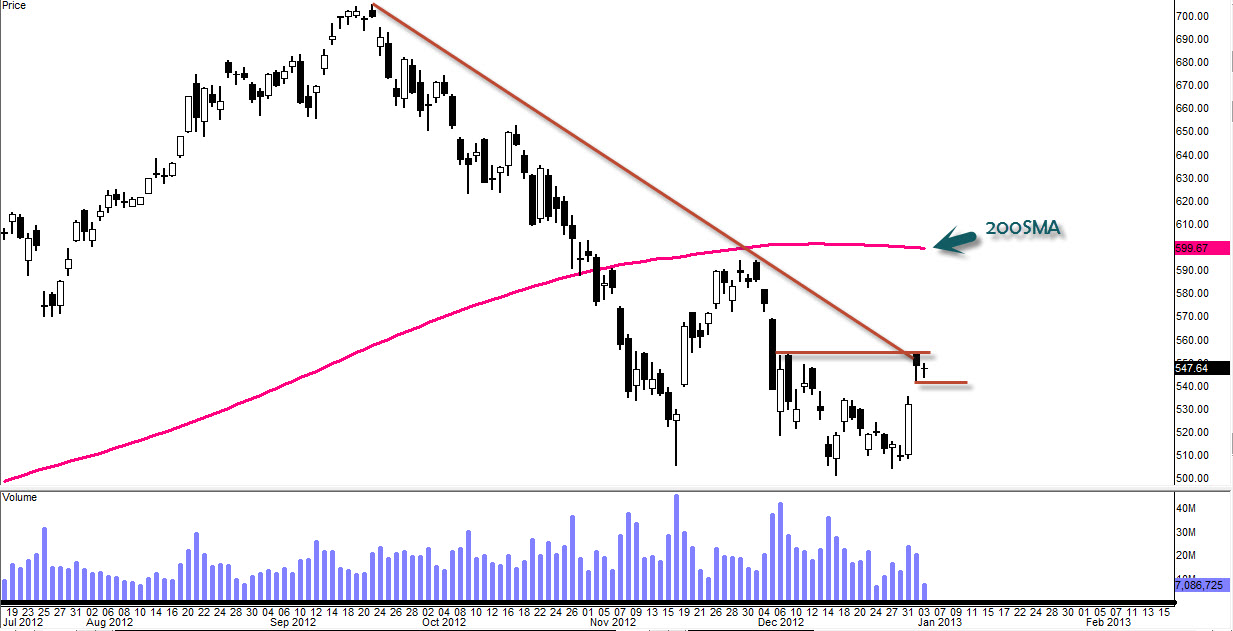
I am still holding my bearish positions since open yesterday morning however it looks like we are forming some sort of bullish continuation pattern here. I am not sure what yet possibly bullish flag, stair-step or pennant but from the looks of it, its been holding up well. Key level is that we do not close below $540 area this week if you are a Bull and converse is true if you are a bear, you want it to close below $540 this week or early next week.
But because today’s action has been pretty weak (for Bears), I decided to put in bullish contingency order for trade order execution if stock trades above 50EMA level which is around $560, I will be triggered long positions while my short positions get closed. However if we continue to travel lower in this vicinity and filling the gap to the downside, my bullish trigger will be obsolete and will continue to hold my bearish positions.
- If triggered bullish, upside target: $600 (where 200SMA is residing)
- If breached $540 level, downside target: $500
[divider]
Bullish Argument
- We are in Bullish market as a whole with strong bullish action last few days
- Bullish Divergences ($AAPL reacts very well to these Divergences)
- Gap from yesterday is still open and it seems like $AAPL is holding up well so far
Bearish Argument
- Long term downtrend resistance from $700 (not confirmed yet) could act as strong resistance
- 50EMA has been acting as strong resistance
- Still in bearish trend with possible weekly Head and Shoulders reversal
[divider]
1.4.13 Friday 9:04AM CT
[divider]
iShort More (Puts) @ $535.49
(Daily Chart | 50EMA)
Three Black Crows (reversal pattern) flying low under 50EMA.
Short-term Reversal Patterns
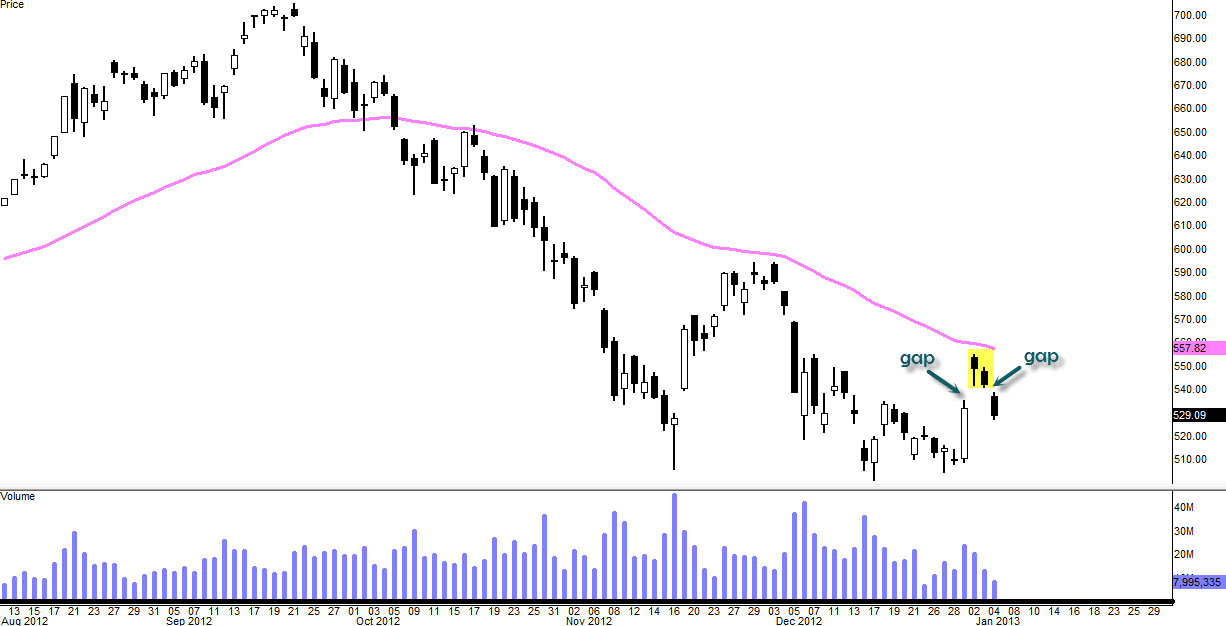
- Island Top Reversal (gaped up and gaped down thus creating an Island)
- Three Black Crows (last three black candles)
- Target: $500
After Close
Week Ending Weekly Chart | 50EMA

50EMA is continue to give $AAPL problem on this weekly chart and the daily chart. Look at the long upper wick formed ending the week today. Just few days ago, this weekly chart looked mighty bullish with the full white candle and it sure did turned around very quickly here.
I wouldn’t call that a Shooting Star reversal because it did not form at the top of trend but in the middle of this sideways movement so I don’t think that candle signifies anything except the fact that bulls took a chance to make a run for it but failed. Look at the declining volume last 4-5 weeks while $AAPL continue to move sideways on this weekly chart. To me, it looks like a continuation pattern such as Stair-step continuation.
$500 level is where bulls need to hold next week or bottom might just fall out and when it does this might just happen.
[divider]
1.8.13 Tuesday
[divider]
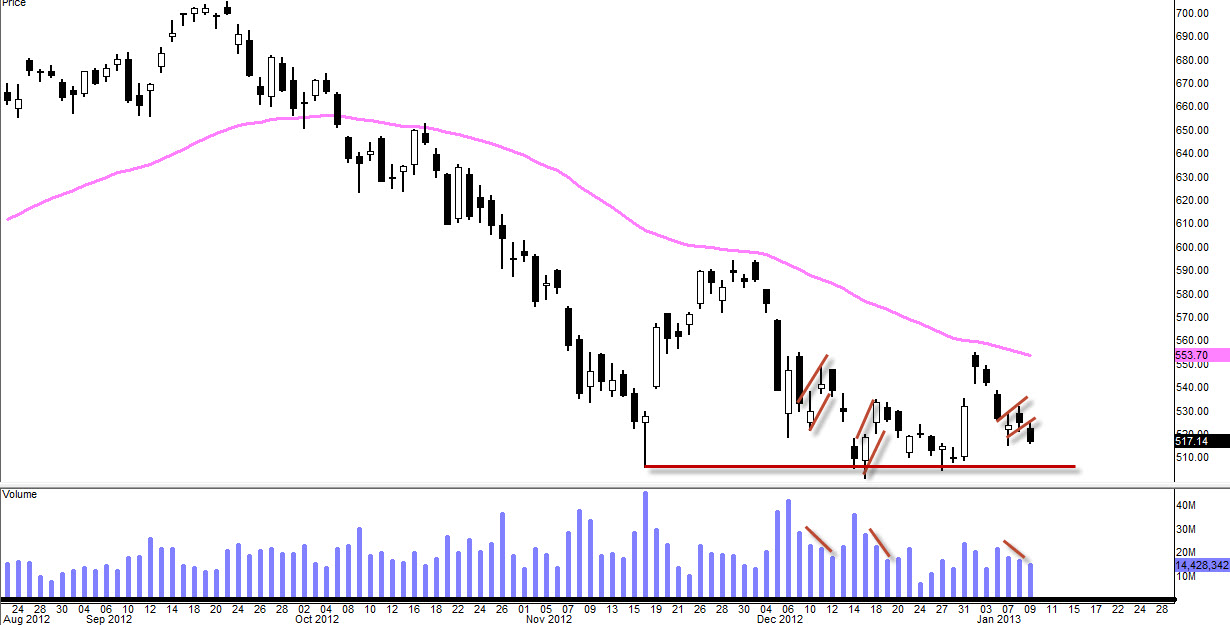
Still Holding Short Positions, Bear Flag
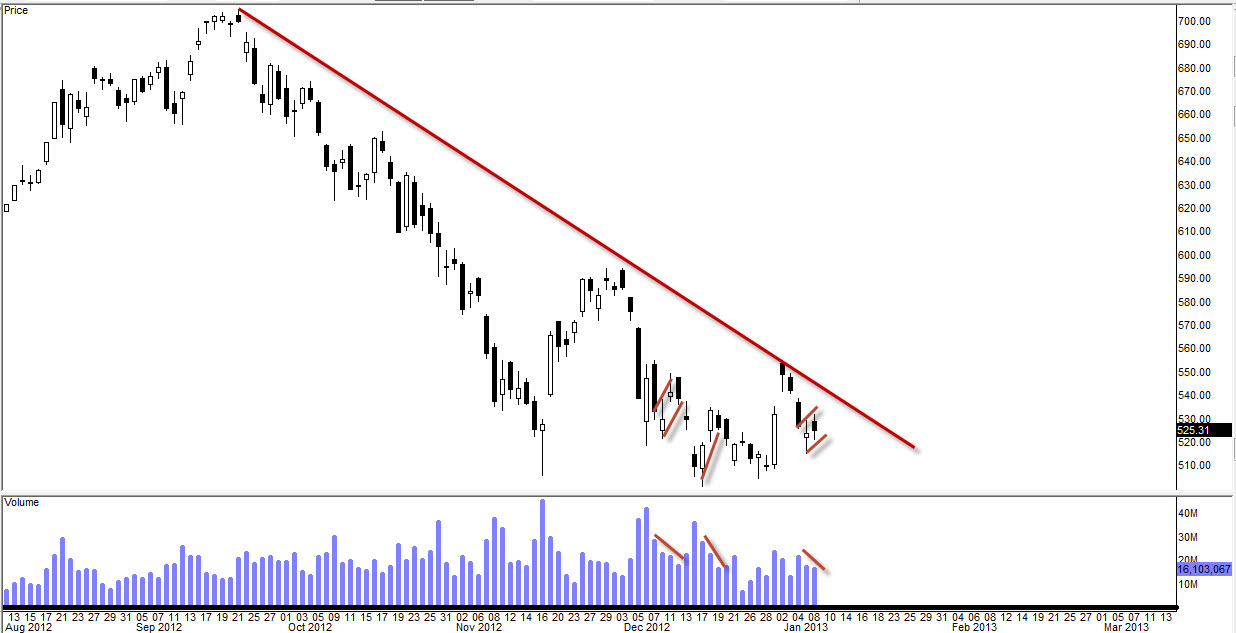
Looks like a Bear Flag to me as the stock trying to climb up but the volume is falling. We’ve had similar situations recently as I have drawn the lines on this chart. Stock goes up, volume falls, stock comes down. That’s what has been working here.
Another possible scenario could be that it might be slowly climbing up to test that long-term downtrend line from above. Either way, if it going to get up, it will have to be supported with some volume spikes otherwise, the gravity force (bears in this case) will drag it down continually.
[divider]
1.9.13 Wednesday
[divider]
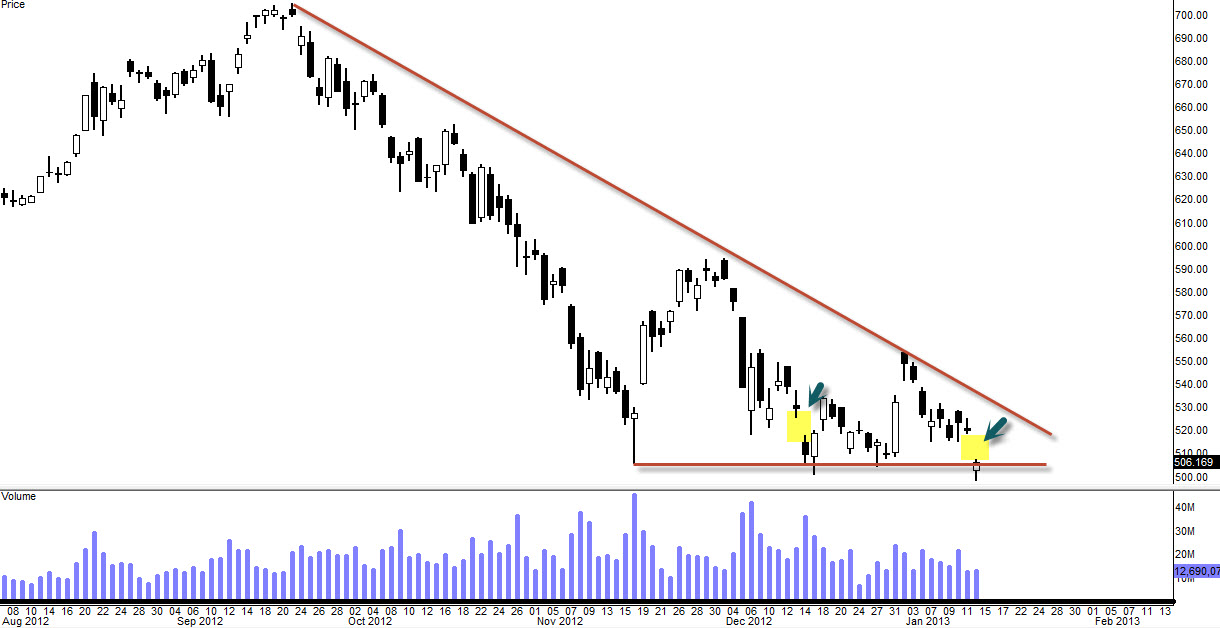
Bear Flagged, Say Hello to $505 Tomorrow
My target is approaching very quickly here at $505. I will be closing most of my bearish positions (Put Options) tomorrow when it touches $505 and I probably keep some just to see if we can break below. Breaking below and closing below $500 level will cause massive panic SELLING.
[divider]
1.10.13 Thursday 8:45AM CT
[divider]
iShort (Puts) More @ Open $528.98
(20EMA – Light Green | 50EMA – Pink)
Still trading below 20EMA, I bought MORE Put Options at open. Target still remains $505 vicinity and $515 is next recent support.
After Close
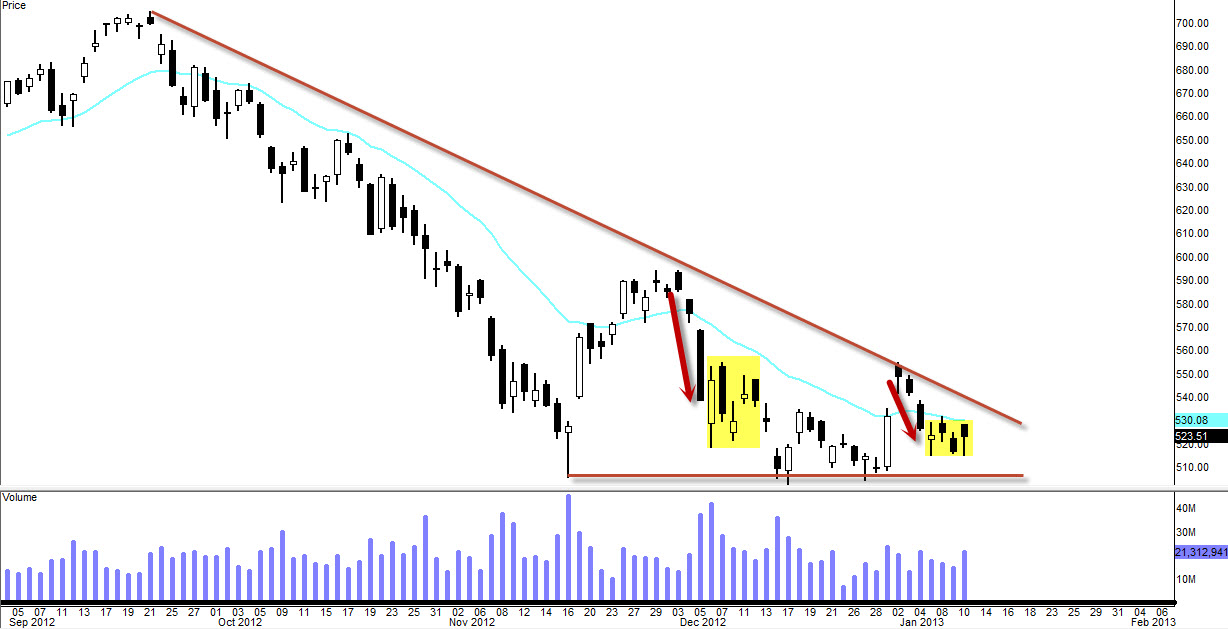
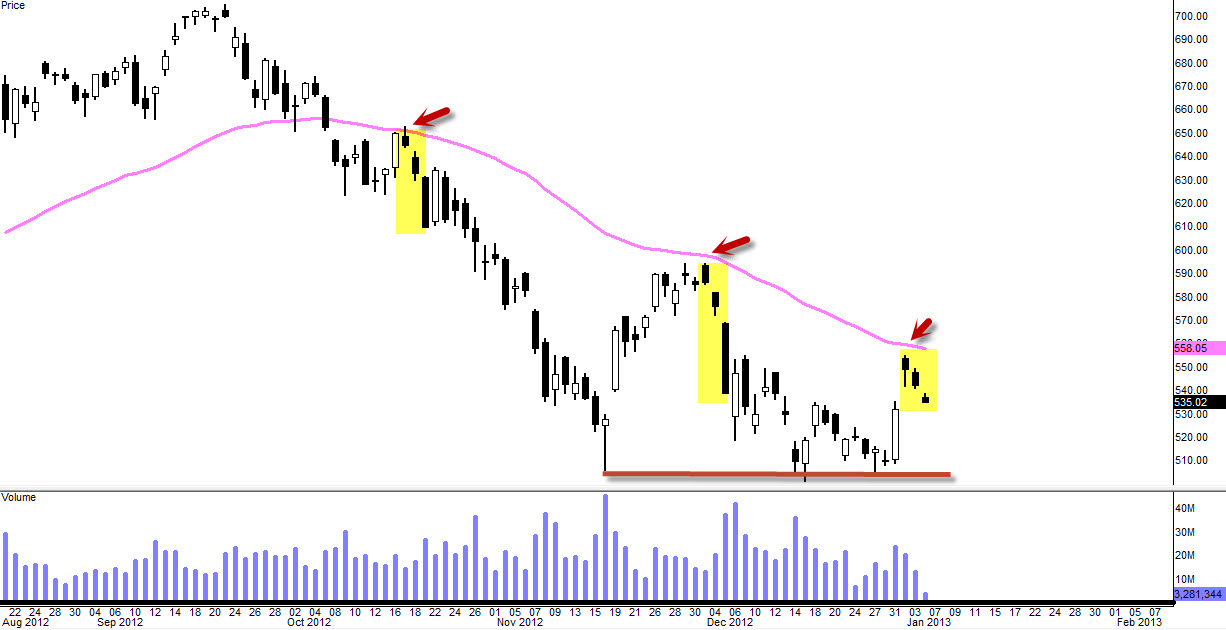
Indeed $515 did act as short-term support and NO this does not mean “WE ARE GOING TO $560 TOMORROW!!!” as I’ve seen someone tweeted that. But here are few scenarios I see happening tomorrow.
- We get up tomorrow but hit that long term downtrend line and struggles to get up any higher
- See yellow shaded boxes – After three days of bearish run, $AAPL consolidated a bit by moving sideways for 4 days and then it resumed it’s bearish move and likely it could happen tomorrow.
[divider]
1.14.13 Monday 10:10AM CT
[divider]
Holding Full Bearish Positions But Maybe Not So Long
If we don’t close strong today, I am afraid there is a high possibility that bulls might have their runs like they did back in 12/14. What happened was, it gaped down on 12/14 and closed with just a Spinning Top candle and on the next day, we had bullish turn around and I am wondering if it’s going to do the same tomorrow. And from the price action so far, I can only assume that the outcome possibly be the similar.
So here is my plan with my bearish positions. Unless it starts to trade below $500 level 20mins before close, I will be completely closing out all my bearish positions before close. Tomorrow, depending on the price action, I might get into little bit of bullish positions for short-term but that has not been determined as of now.
11:10AM CT
Closed Out 1/2 of my Bearish Positions
2:59PM CT
I am Completely Out of My Bearish Positions @ $501.10
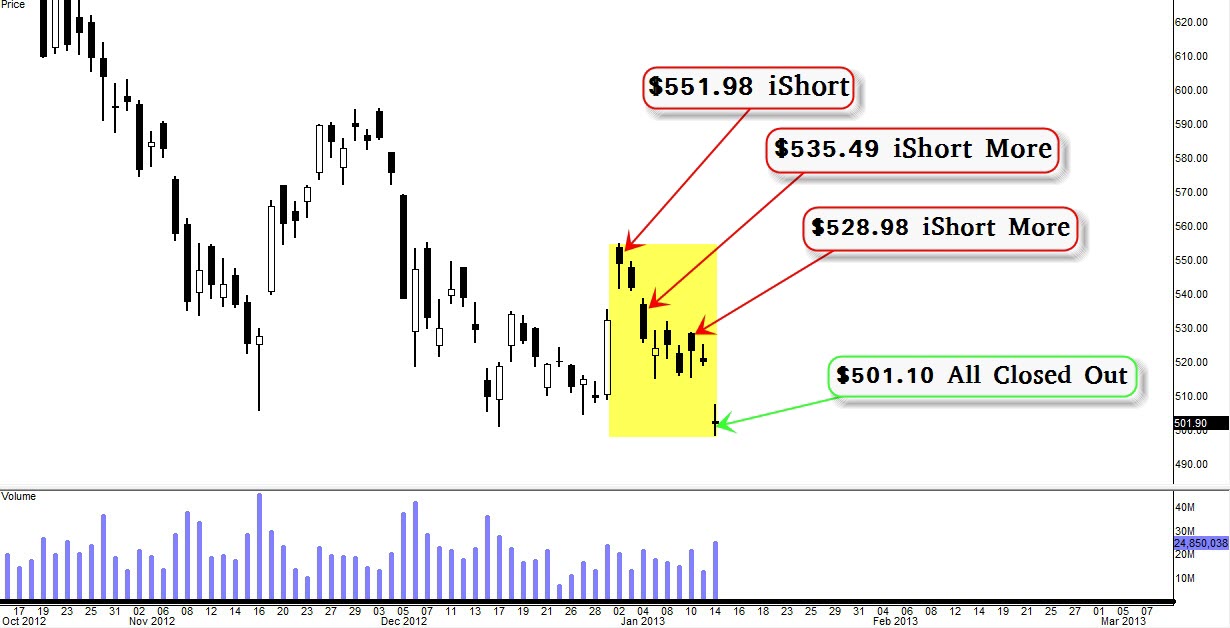
$50 bearish trade in two weeks.