[divider]
12.28.12 Friday
[divider]
With so much talk on Fiscal Cliff, the market is continue to show some weakness and one of the biggest advantage of technical analysis is you can see the sentiment of current news. Many people think that technical is far from fundamentals but it’s not true. Usually many fundamental analysts have to wait until the final decision of certain news or event to get into the trade but technical analysts can see the sentiment before it happens and forecast the possible scenario with probabilities and statistics of market’s current conditions.
Biggest question is NOT how they are going to resolve the Fiscal Cliff but the big question is regardless of the outcome, how is the market going to react to it. That’s what it all matters right? We all know and seen that certain company has great fundamentals *cough* $AAPL *cough* and yet it loses 200 points in 2-3 months. So it’s not so much of why certain thing happened but more of how did the stock or the market react towards to that certain news or event.
So looking at these charts, I am seeing some panic and fear coming into the market place and if the resolution is negative on Fiscal Cliff, I believe its going to continue to kill the market.
[divider]
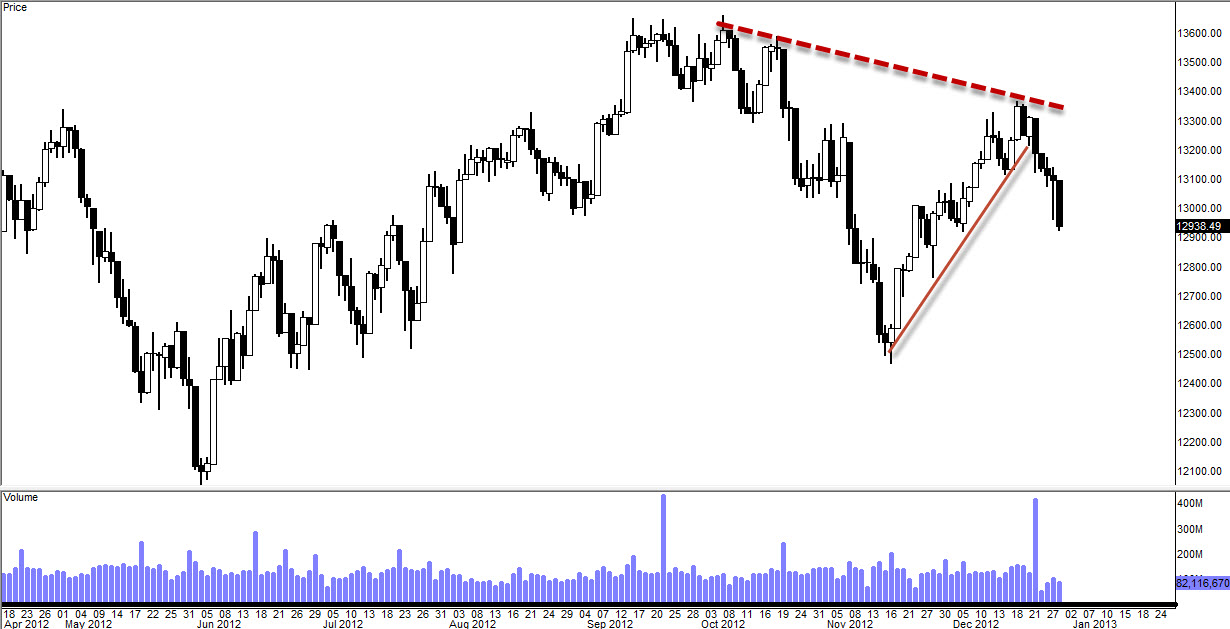
Downtrend Resistance Established, Recent Uptrend Broken
Dow Jones Index-Daily Chart
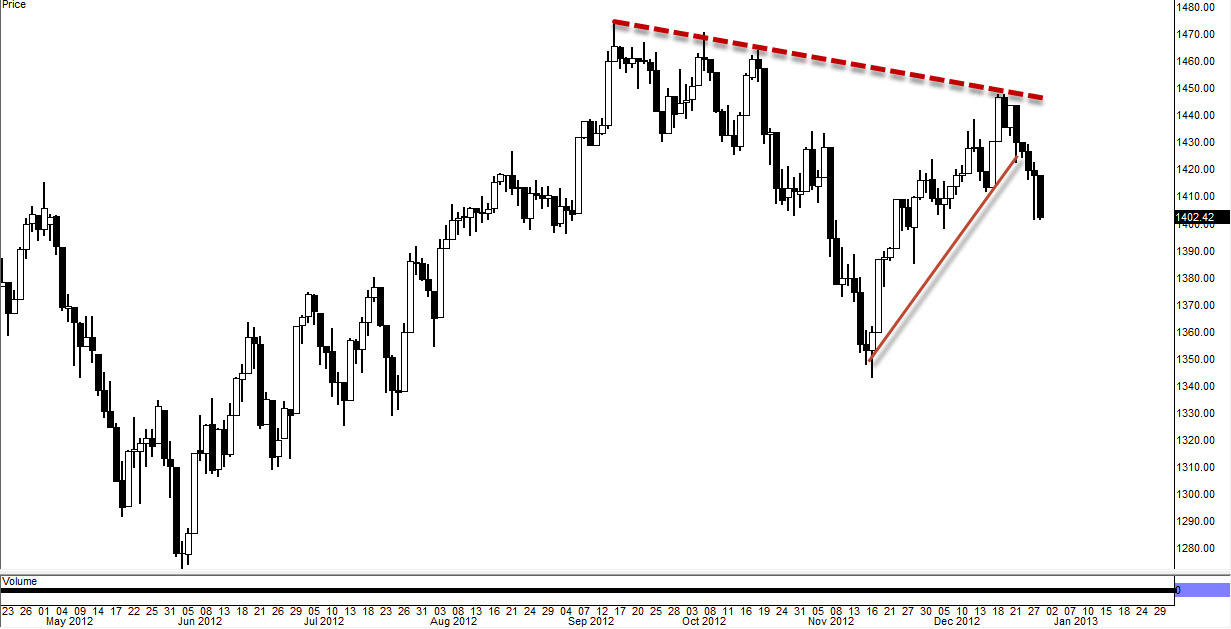
S&P 500 Index-Daily Chart
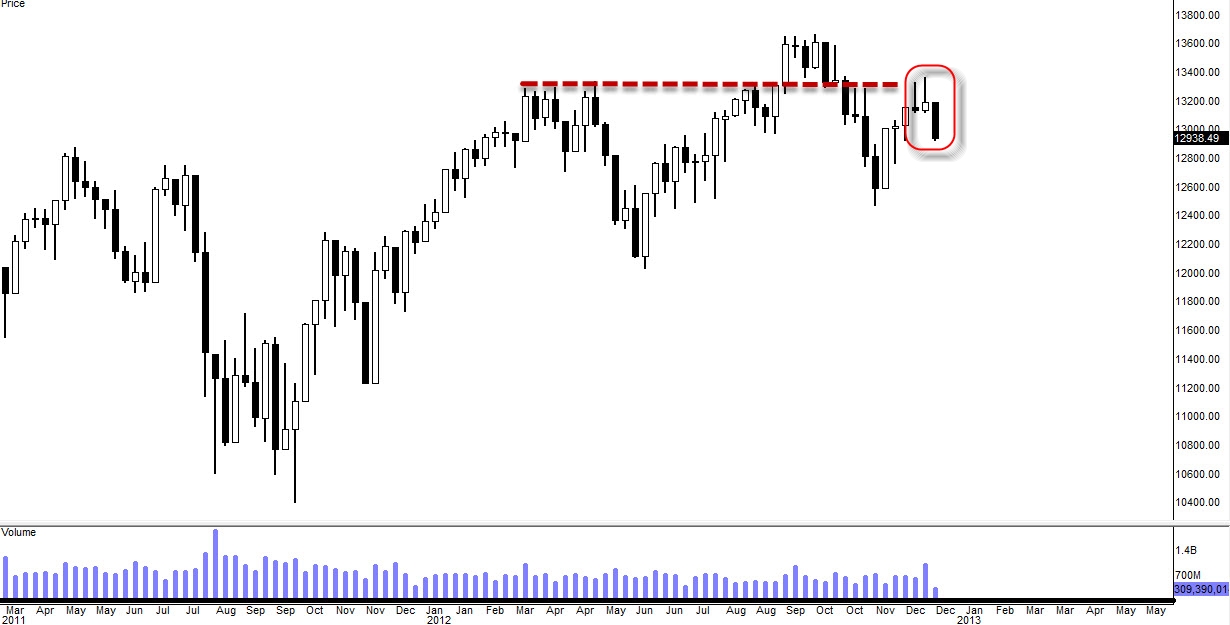
NASDAQ Composite-Daily Chart
Thoughts
First let’s talk about drawing Trend Lines.
Technical rule is this: 2 points to draw and 3 points to establish. And by 3rd point, it has to make a solid peak to qualify as the 3rd point to draw off of which means just because it touched it, it does not mean that it becomes a trend line (I am surprised how many people do this). It has to touch it and then has to roll over to create a peak and that’s how we confirm the trend line. We have 3 points established downtrend resistance confirmed on all three indexes. This suggests that we are possibly seeing new bearish trend starting off 2013.
For bullish aspect, bulls need to break above those downtrend lines closing above with convincing bullish candle but until then the SENTIMENT is BEARISH (Intermediate terms since Primary term (long term) is still bullish).
Both Dow and S&P has broken the recent uptrend support however NASDAQ is still trading above the key level of the Triple Top neckline. To confirm bearish, it must close below that neckline. So technically NASDAQ is only index without bearish trend confirmation yet.
Let’s take a look at the weekly chart and see what we might be expecting next week.
[divider]
[divider]
Weekly Candle & Chart Formations
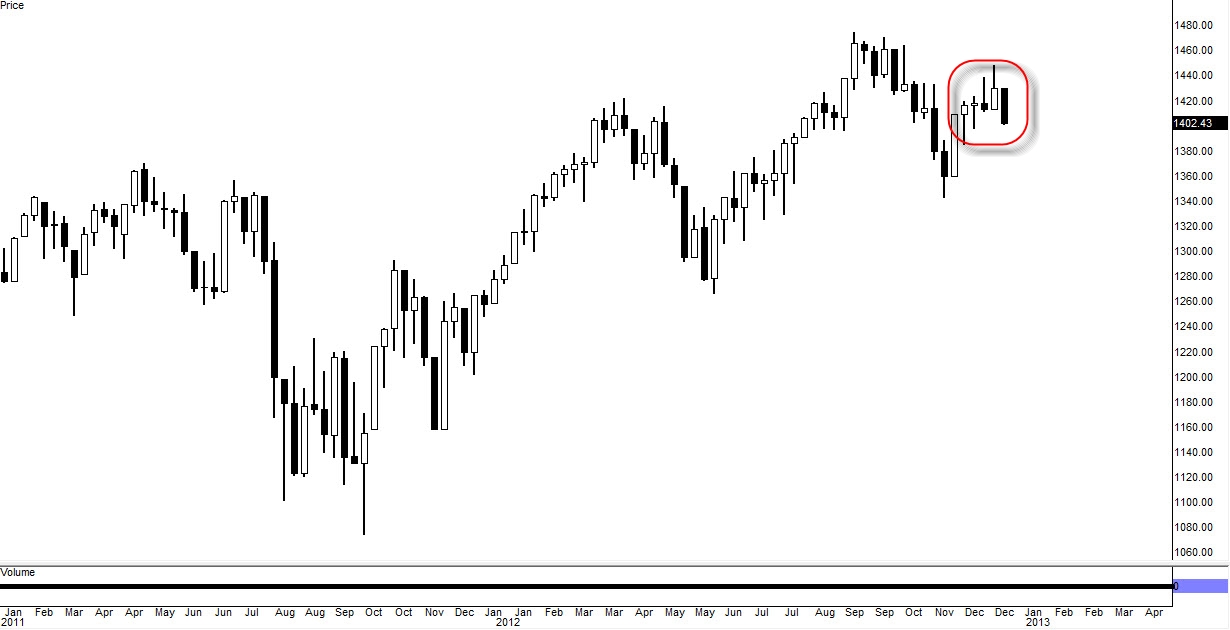
Dow Jones-Weekly Chart
Last three candles: 2 Shooting Star Reversals followed by 1 Black Crow
As I have mentioned on my last Weekly Market Update that those two shooting star reversals could be problem going in the week and sure enough it created a huge bearish candle.
Shooting star reversal followed by 1 Black Crow is probably one of the strongest reversal formations (behind Island Reversal which is the strongest). In this pattern we can also say that we have Bearish Engulfing pattern since this week’s candle engulfs not only last week’s candle but last three weeks candles. so we have very strong reversal candle formation on this weekly chart. I wouldn’t be surprised to see 3 Black Crows forming next few weeks.
For Bullish aspect: Bulls needs to close above that resistance (red dotted line) with convincing bullish candle piercing through it.
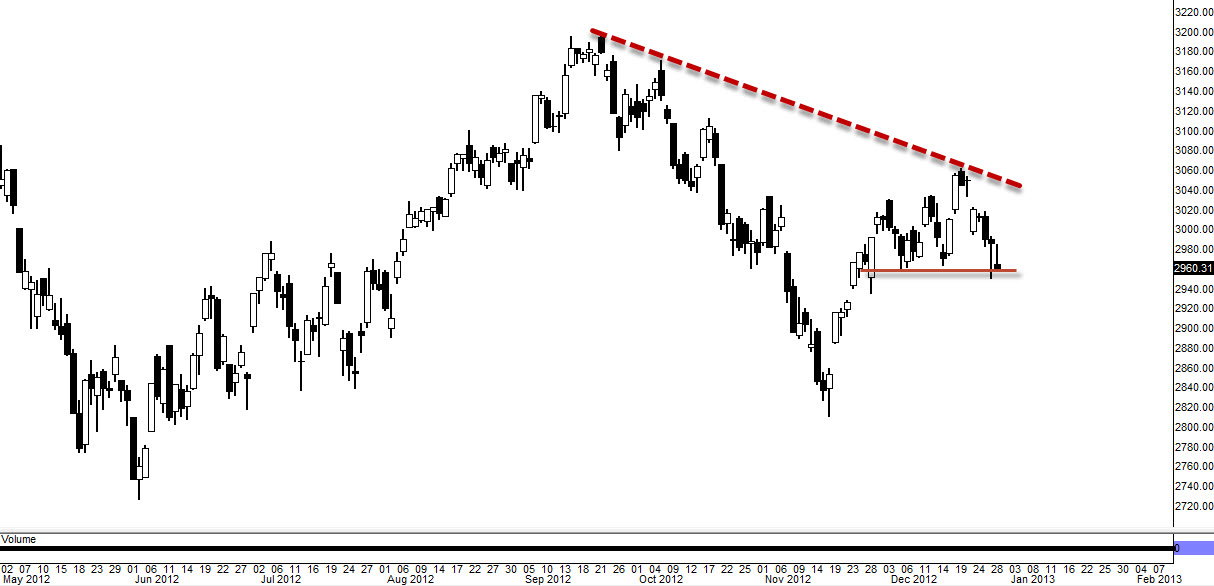
NASDAQ Index-Weekly Chart
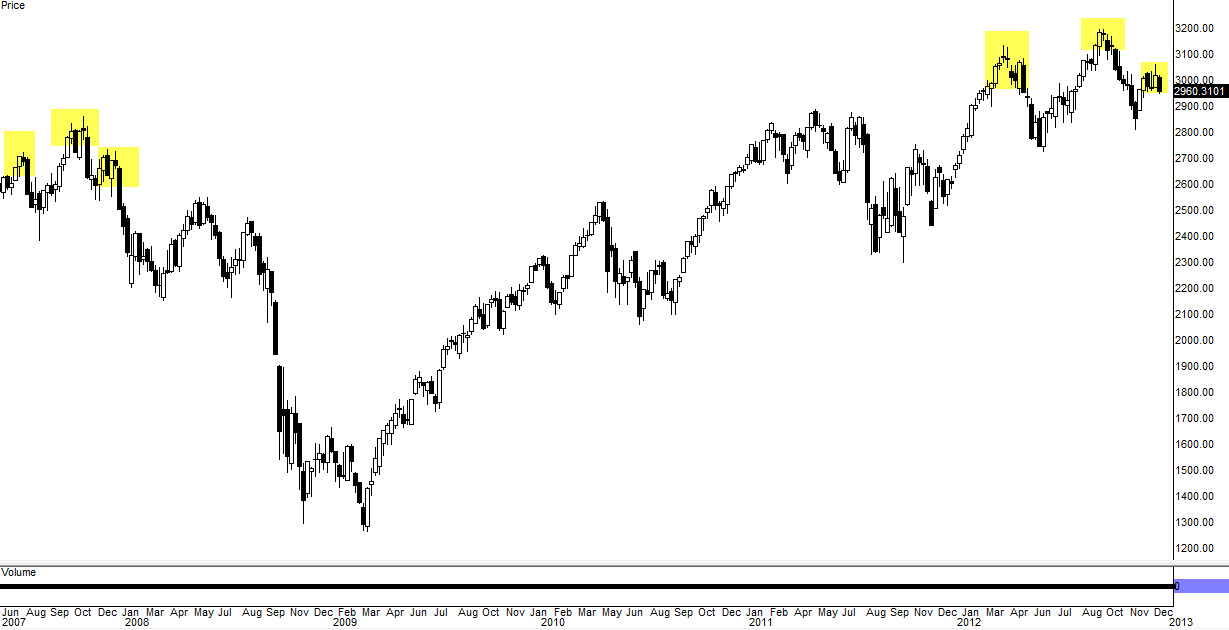
Head and Shoulders chart formation is still a huge warning sign as you can see that on 2007 we formed Head and Shoulder, confirmed by breaking the neckline then it crashed after some bounces. We have similar formation but with bigger scale. This H&S will be confirmed if close below $2,800-$2,700 vicinity. If the H&S confirmed, we could see massive market downturn on this index.
S&P500 Index-Weekly Chart
Bearish Engulfing
This bearish engulfing candle formation engulfs last four weeks of candle bodies. This is a very bearish signal in candle formations. It’s not as strong as the Dow Jones weekly candle formation because we do not have well defined Shooting Star candle last week but I think the potency will be similar.
[divider]
12.30.12 Sunday
[divider]
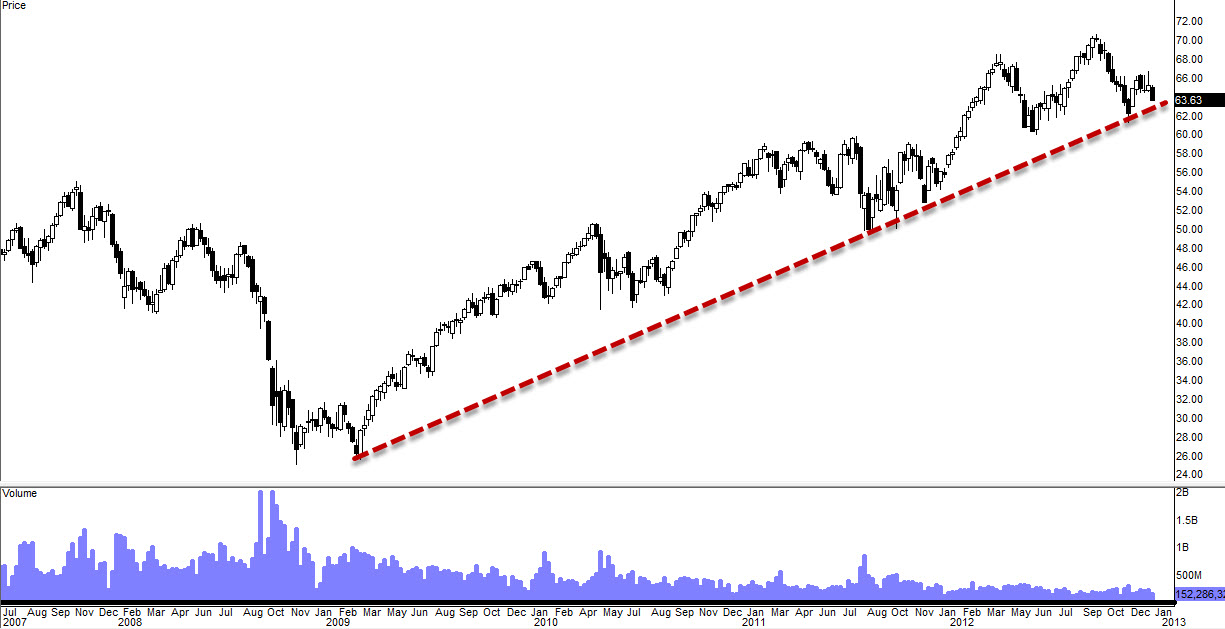
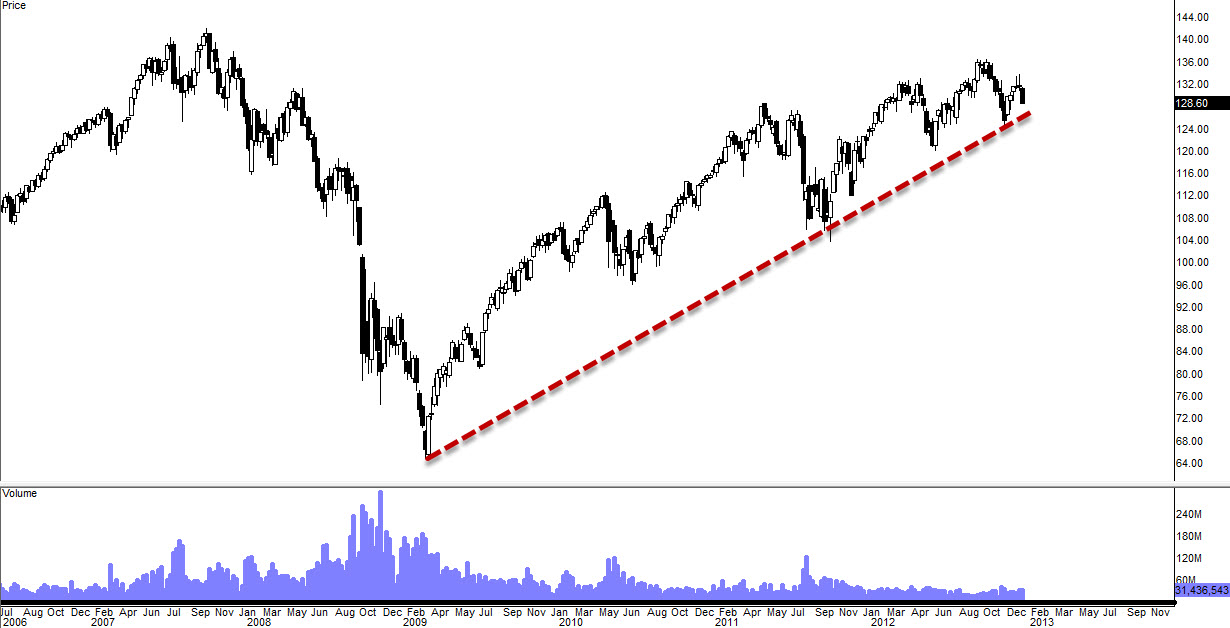
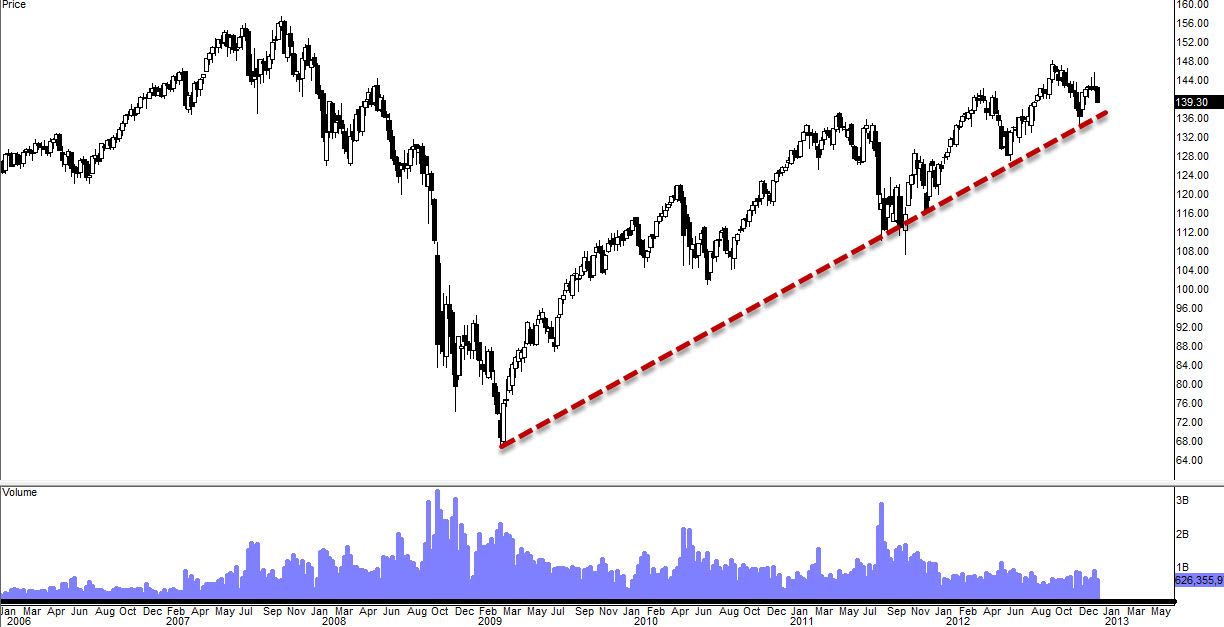
Here are some very important levels of weekly uptrend support. Since this is a weekly chart and weekly support, we would need to watch this 2-3 weeks to see how it pans out. If we close below these uptrend support levels, I’d say it’s going to get pretty ugly because we’ve already have many other bearish reversal patterns forming on top of that (such as MACD Divergences and H&S patterns on the weekly).
We could find some support in these areas and possibly bounce or slow down. So watch these levels next 1-3 weeks and see if it’ll hold.
[divider]
$DIA Weekly Uptrend Support
$SPY Weekly Uptrend Support
$QQQ Weekly Uptrend Support