My market motto is, “sell when I am cocky as f*ck and buy when I am scared-sh*tless.”
During the March of this year, when we went through that 20% flash-crash on SPY in just over a month, I knew this was going to be one of the biggest buying opportunities we’ve seen in years.
Only question was where would I be start accumulating?

SPY WEEKLY-CHART SCREENED END OF MARCH
During end of the March, upon investigating my weekly-“Histogram,” I’ve quickly realized that we were at a level we haven’t seen in 5 years (see red arrows)!
Not only that, the Histogram was at the level where 2020 Covid crash took place and it was retesting the lowest point since the Covid crash. I’ve quickly realized that 2025-Tariff crash was going to be one of the best buying-opportunities since 2020 Covid (because the outcome could be very much similar – read more on this).
This was the level (SPY 490-500’s) I’ve started to load up my longs including call options (LEAPS).
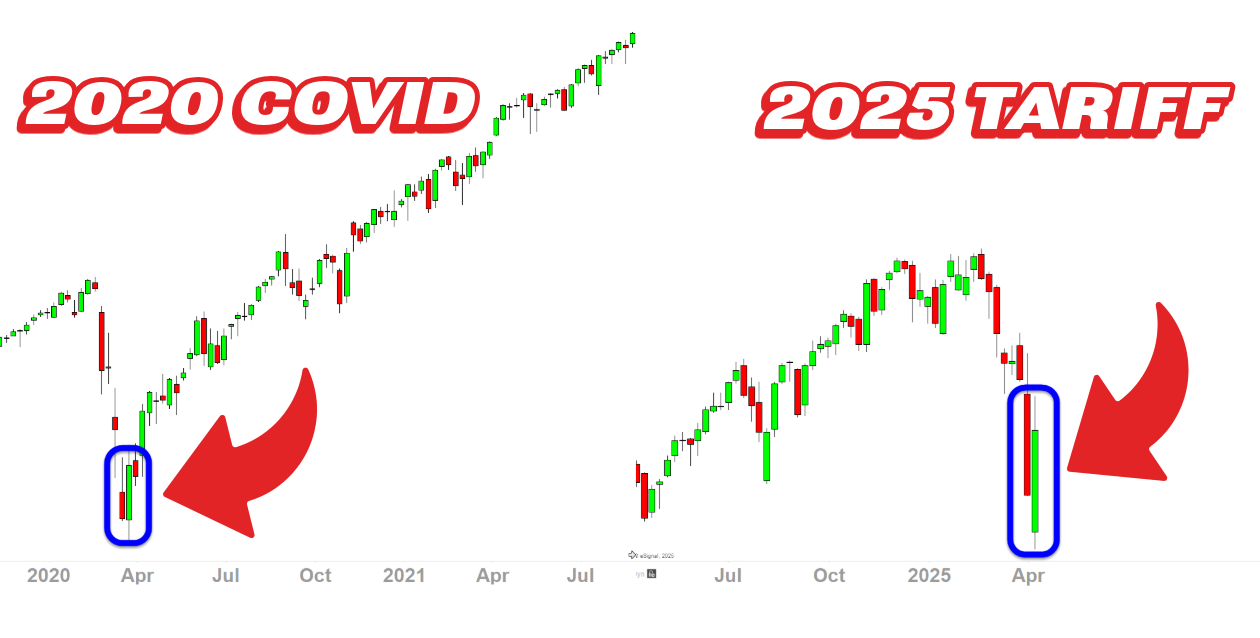
SPY WEEKLY-CANDLES CHART SCREENED ON FIRST WEEK OF APRIL
About a week went by since the Histogram signal.
I’ve checked my weekly-candles (as you see above) on SPY, I was able to quickly identify that we’ve closed the week with a “BULLISH PIERCING” reversal candle; this was similar to during 2020 Covid with a “BULLISH ENGULFING” reversal candle that was created back in 2020.
Now, all it required was a few weeks of follow-through moves and the rest was going to be history–check your SPY weekly-candles see how they look today.
VIDEO FROM LATE APRIL
To put the icing on the cake, I’ve also found that the BULLISH DIVERGENCE was forming on the daily chart as I’ve explain on the video above. This particular signal has not failed to produce the low in 2 years (watch another video regarding the divergence).
This is how I was able to find the low during 2025-Tariff crash and able to accumulate while the mofoz were panic selling preparing for the recession.

