
Positions
Daily-Charts with 50EMA and Volume
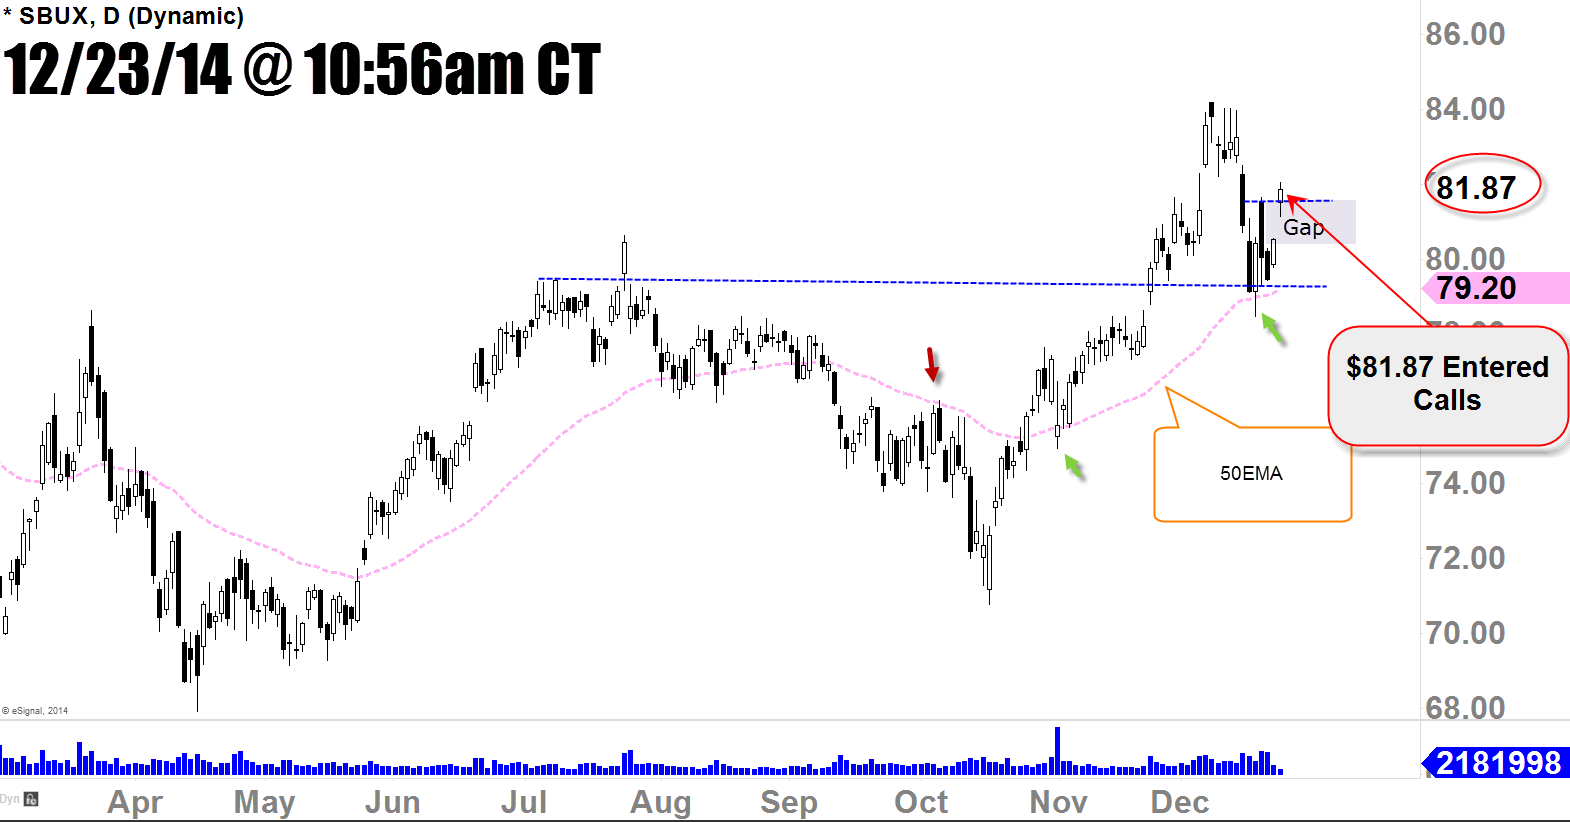
Above chart from the last article
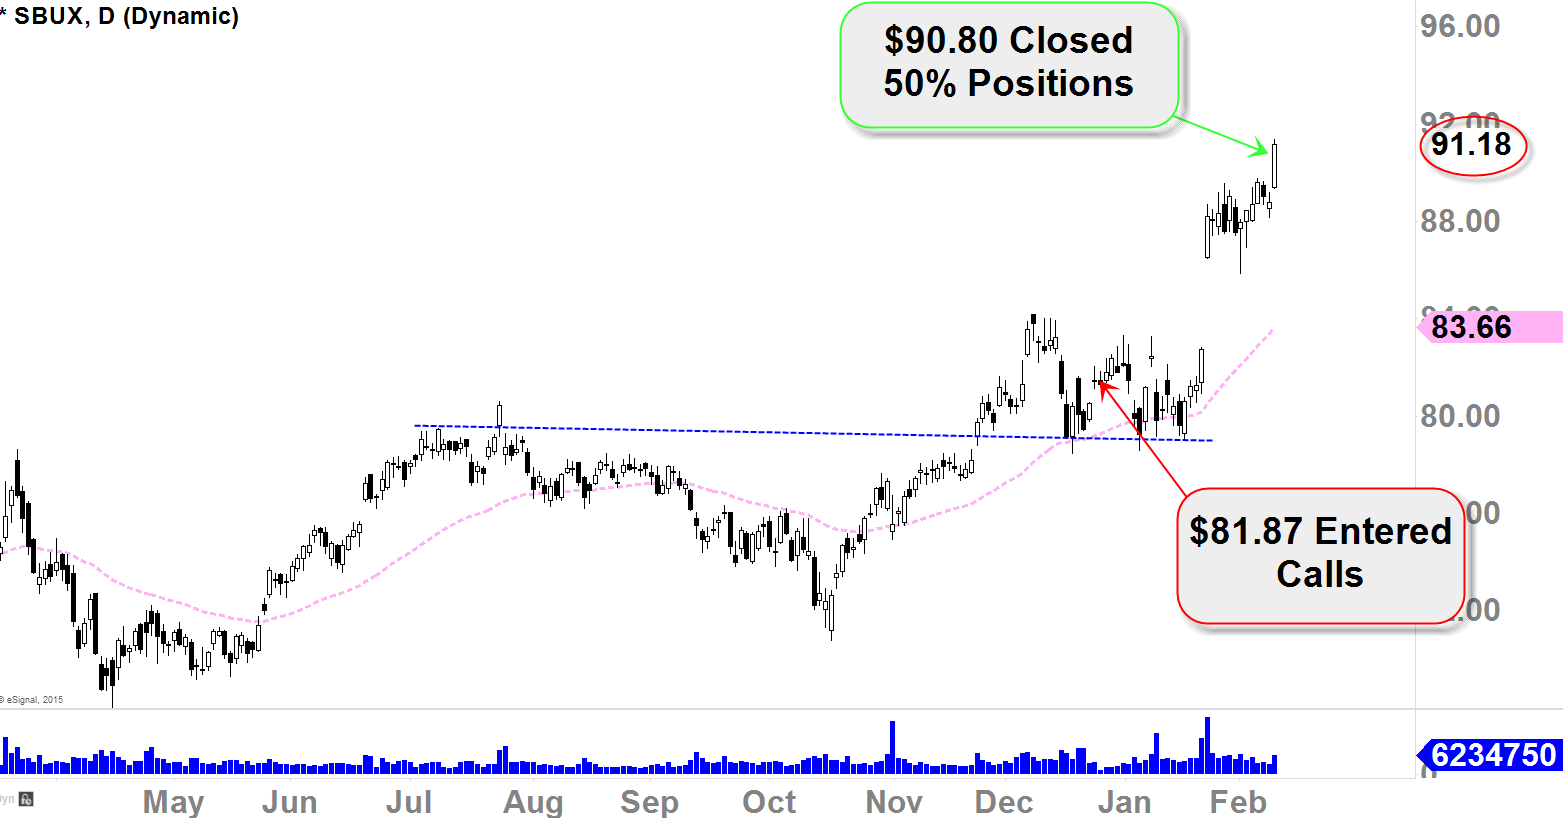
So we have been holding our Call positions since late-December; and with a good ER results, in over a month, Starbucks (SBUX) had a good run since our initiation at $81.87. We decided to close 50% of our holdings earlier today because it’s getting near to our target which was $92ish (which was mentioned on our last article). We still think Starbucks have more to go to the upside in the minor and intermediate term and that’s why we are still holding remaining positions. With daily-10EMA bounce on 2/2/15, our suggestion is to watch daily-10EMA as your guide in the minor to intermediate term price-action. As long as it stays above daily-10EMA, it is perceived as bullish.
Primary Trend
Weekly-Chart with 50SMA and MACD
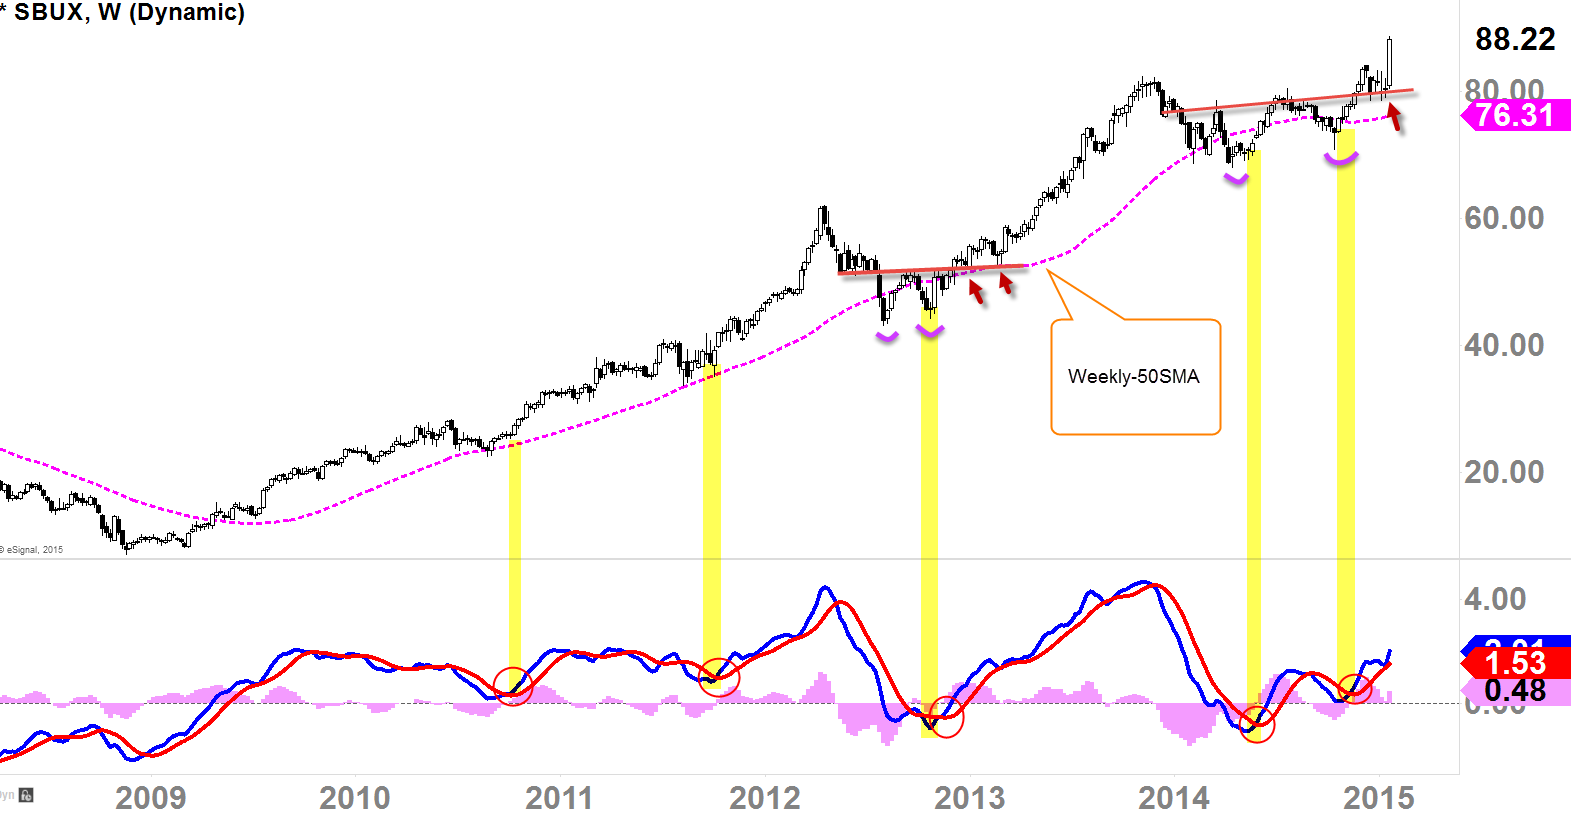
This chart/analysis was done back in January 25, but it still is very much relevant and prudent looking at the long-term perspective. Above chart is indicating that Starbucks (SBUX) might have another good year similar to 2011 or 2012 or 2013. I would recommend you to watch weekly-MACD readings at “4.70” for the long-term target.


