[divider]
Related Articles
10.15.14 “[RECORDED LIVE] LIVE Mid-Week Update with Kay Kim”
10.16.14 “$QQQ $COMPQ NASDAQ Composite Index and the Buyers Preparation”
10.21.14 “$SPY $QQQ The Final Push”
[divider]
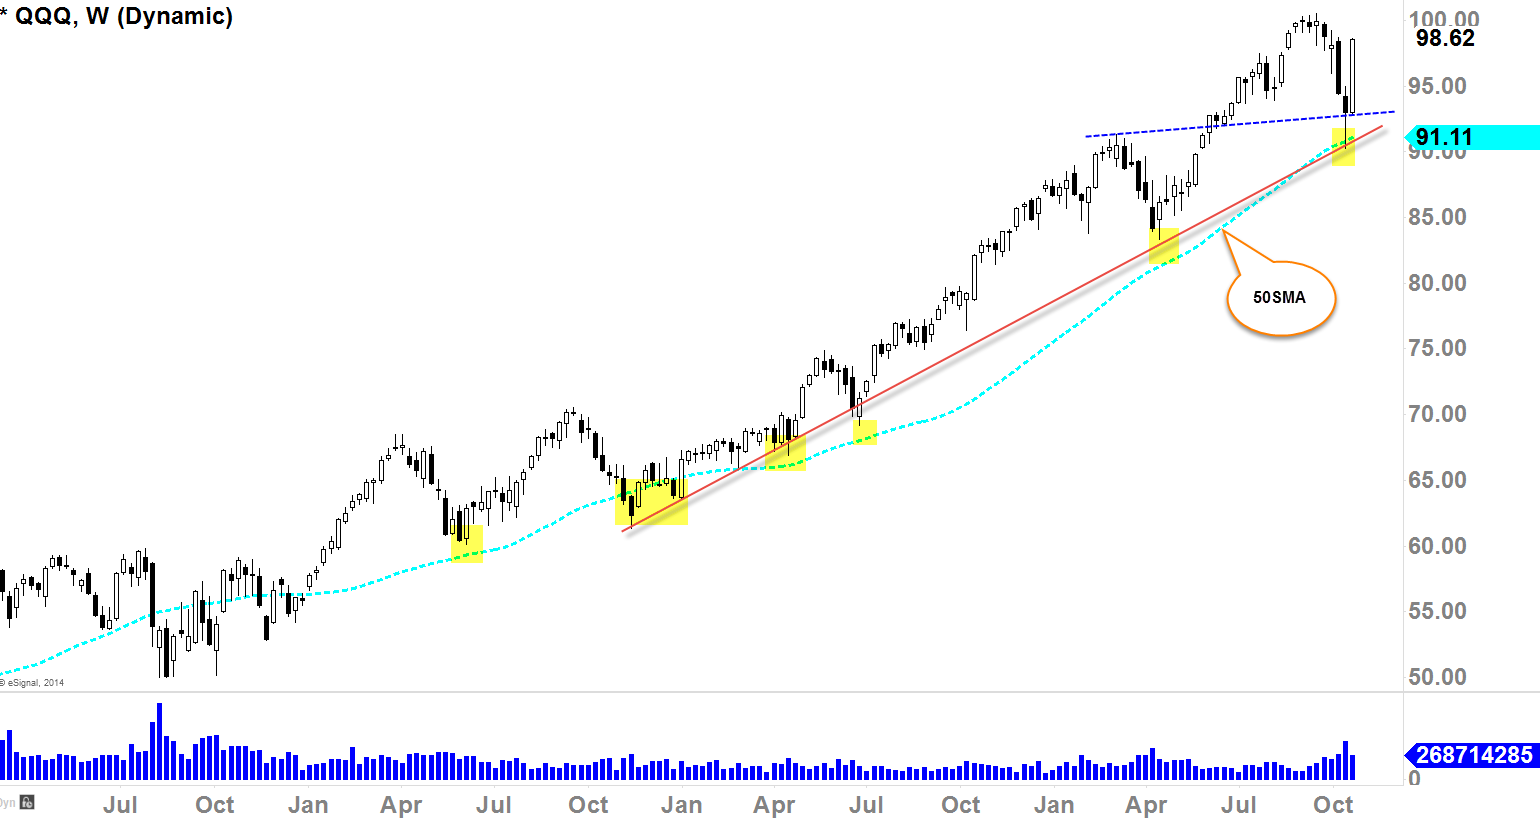
MACD’s Prefiguration
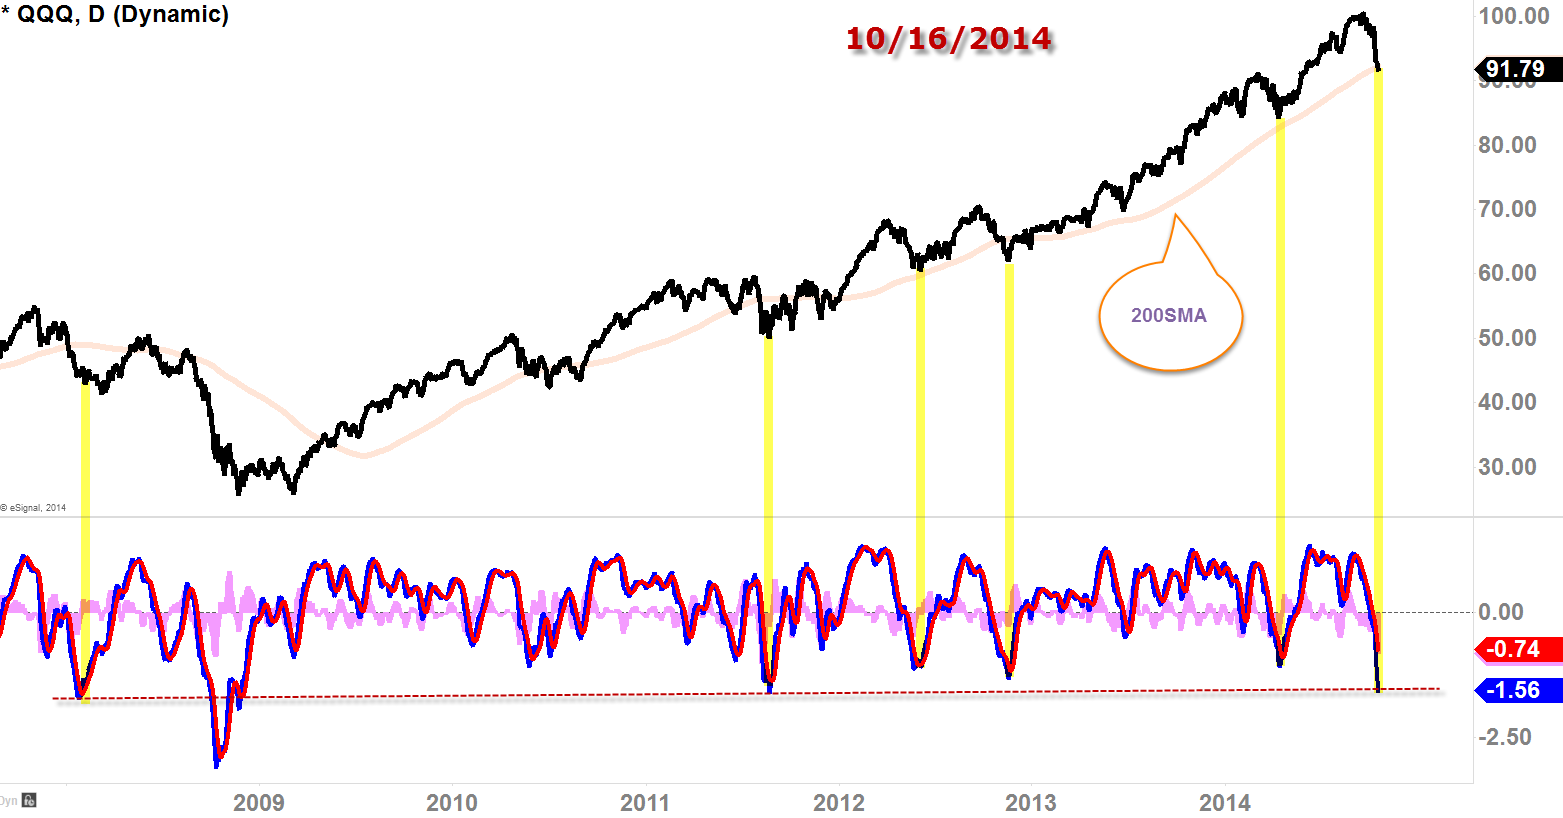
[Above chart featured on last article 10/16/14]
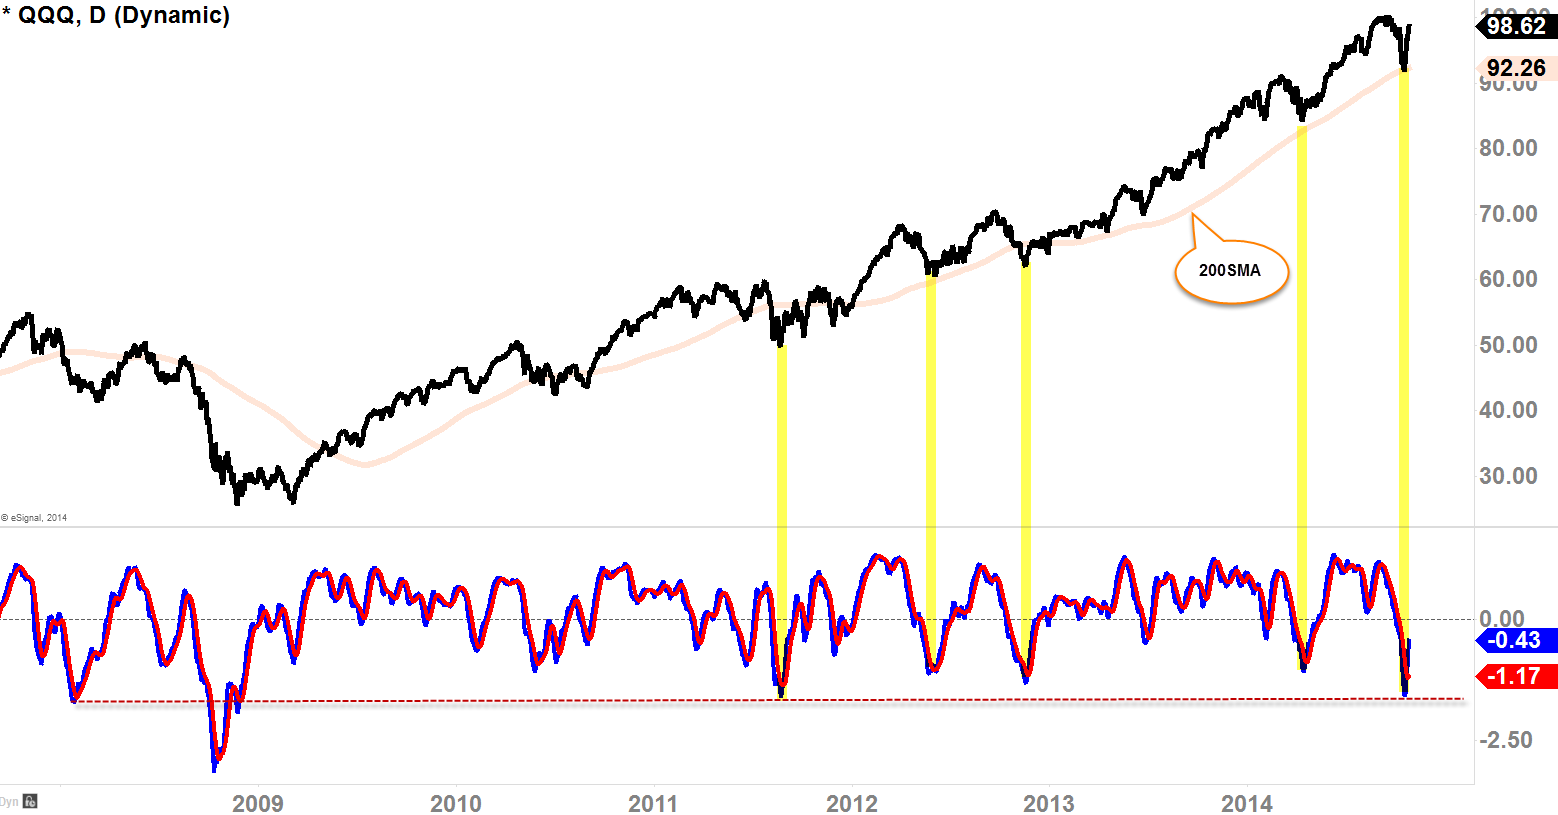
$QQQ moved about 7 points since the 16th, and firmly bounced off of 200SMA while the MACD also bounced right on that support level I’ve drawn here (see highlights). We call these reactions an “uptrend” (sarcasm tone insinuated). That’s what it does. It makes higher lows and higher highs and it continues. And yes, all trends die at some point, but can anyone really tell me looking at current price action, this is actually the top? No one can’t, because we still do not have legitimate, primary-term, lower high on this well defined and prolonged uptrend. I was emphatically advocating the characteristics of an uptrend, and the signals of topping patter on my last LIVE event (10/15/14). I do think we have good probability that the market continues to move higher, however, because we’ve had 7 days of bullish run, I do think the volatility might kick in here this week and potentially next week as well. That does not mean it’s going to roll-over but I think we might see some slow down or short-term pullback or it could just grind higher very slowly. NASDAQ Composite has been the strongest index since the June, and weekly chart looks very strong, and we will talk about the weekly chart at the end of this post.
[divider]
[divider]
Our Positions
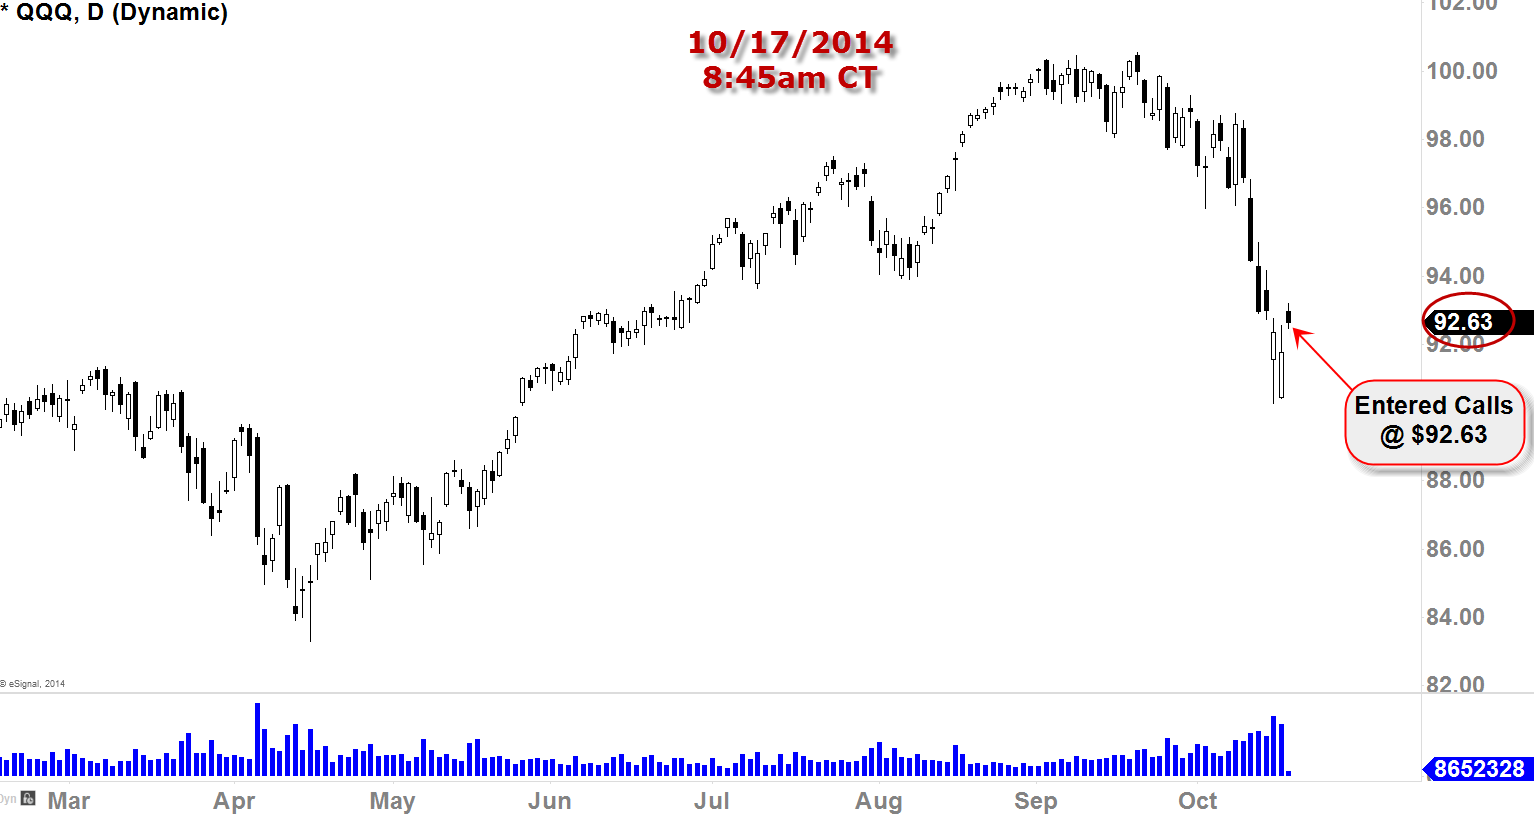
[Entered $QQQ Calls @ $92.63 on 10/17/14 8:45am CT]
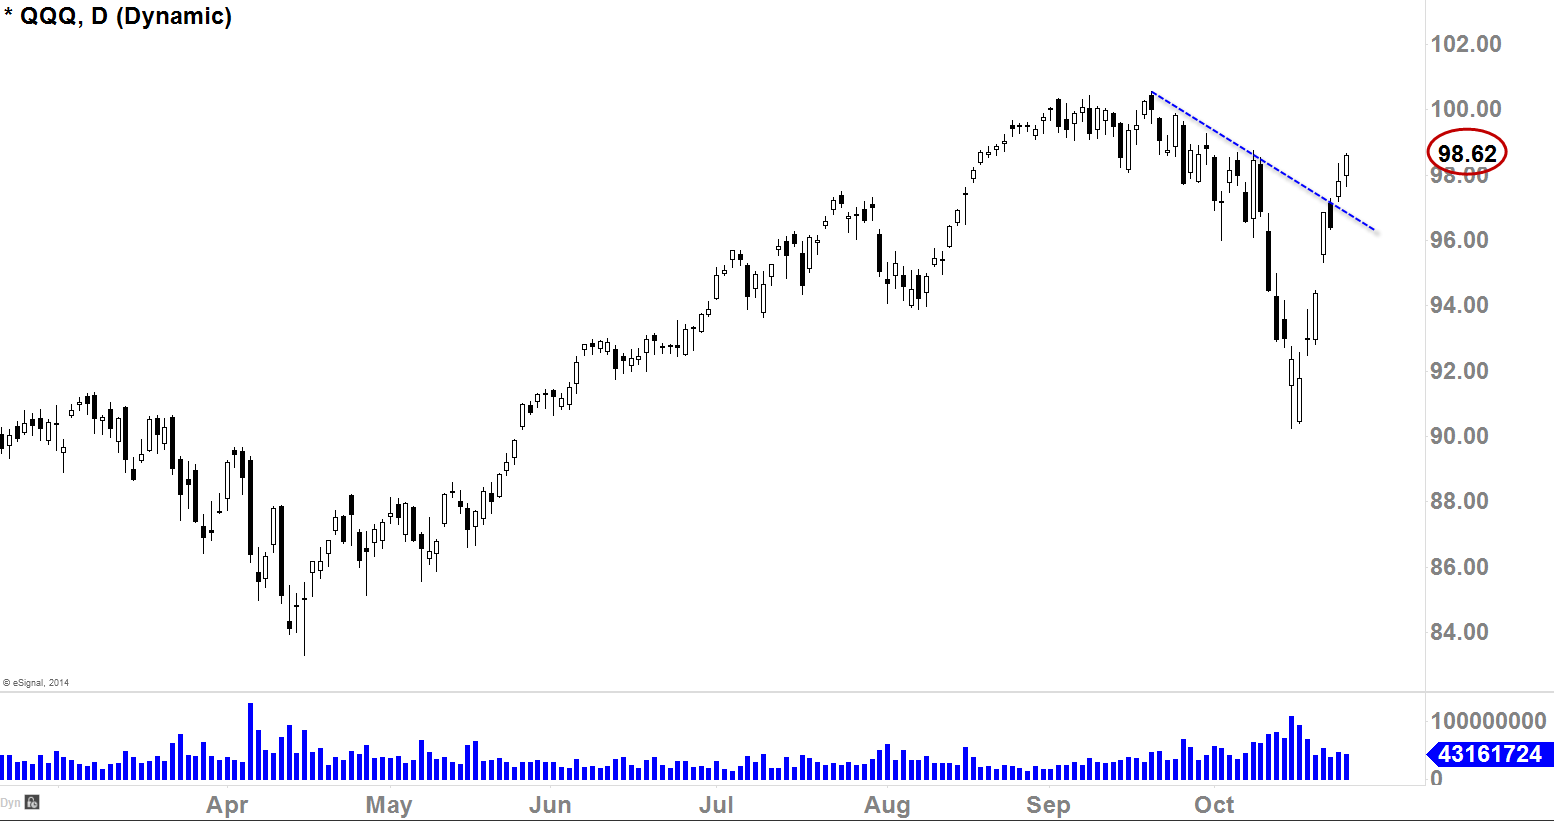
$QQQ cleared recent resistance line after a firm bounce with an ‘Island Reversal’ bottom, and looks to be it can continue grind higher with potential volatility starts to kick in.
[divider]
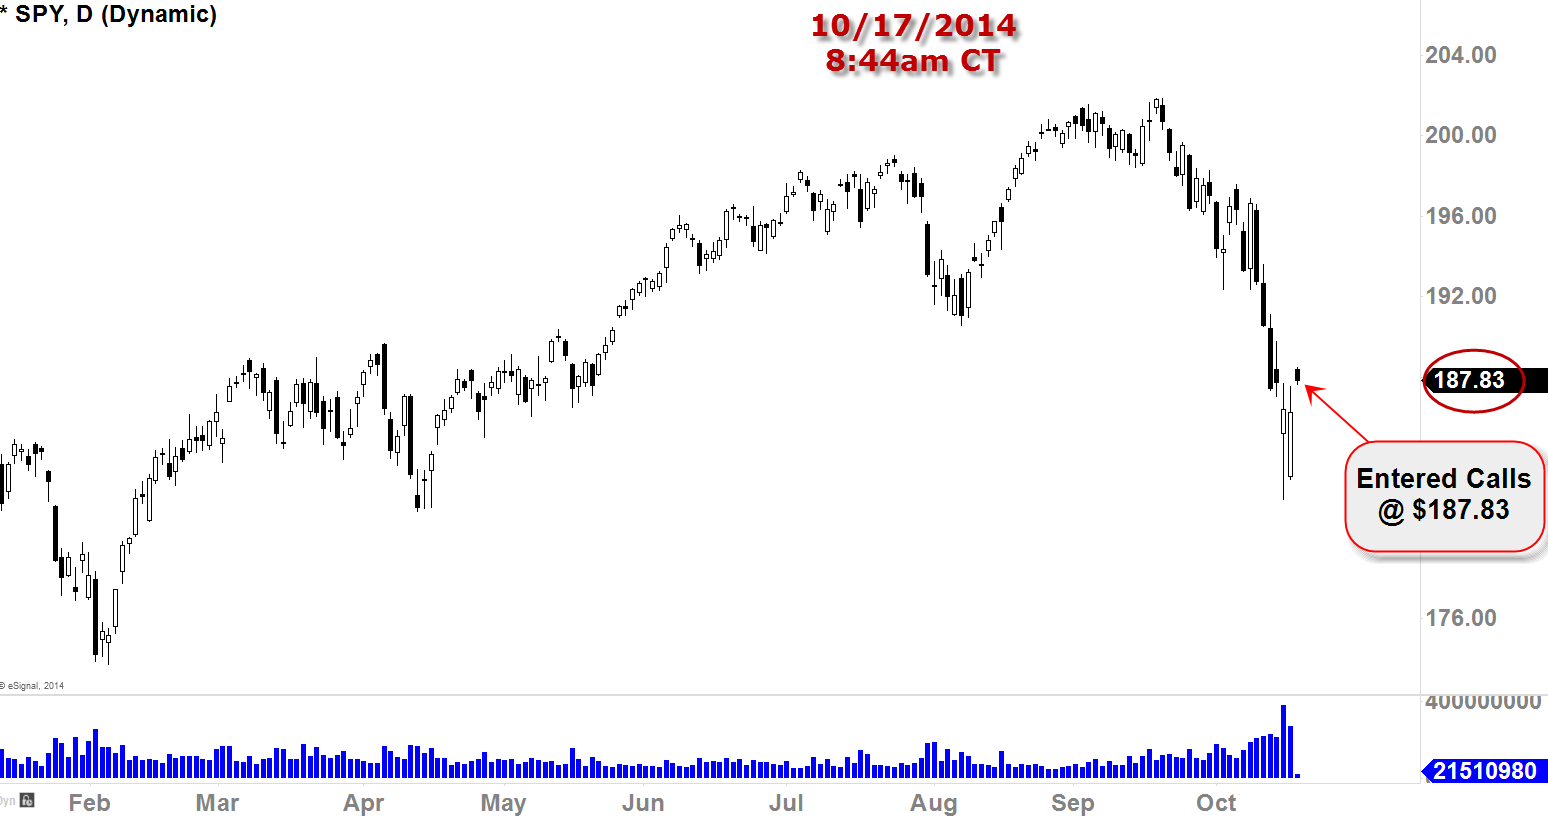
[Entered $SPY Calls @ $187.83 on 10/17/14 8:44am CT]
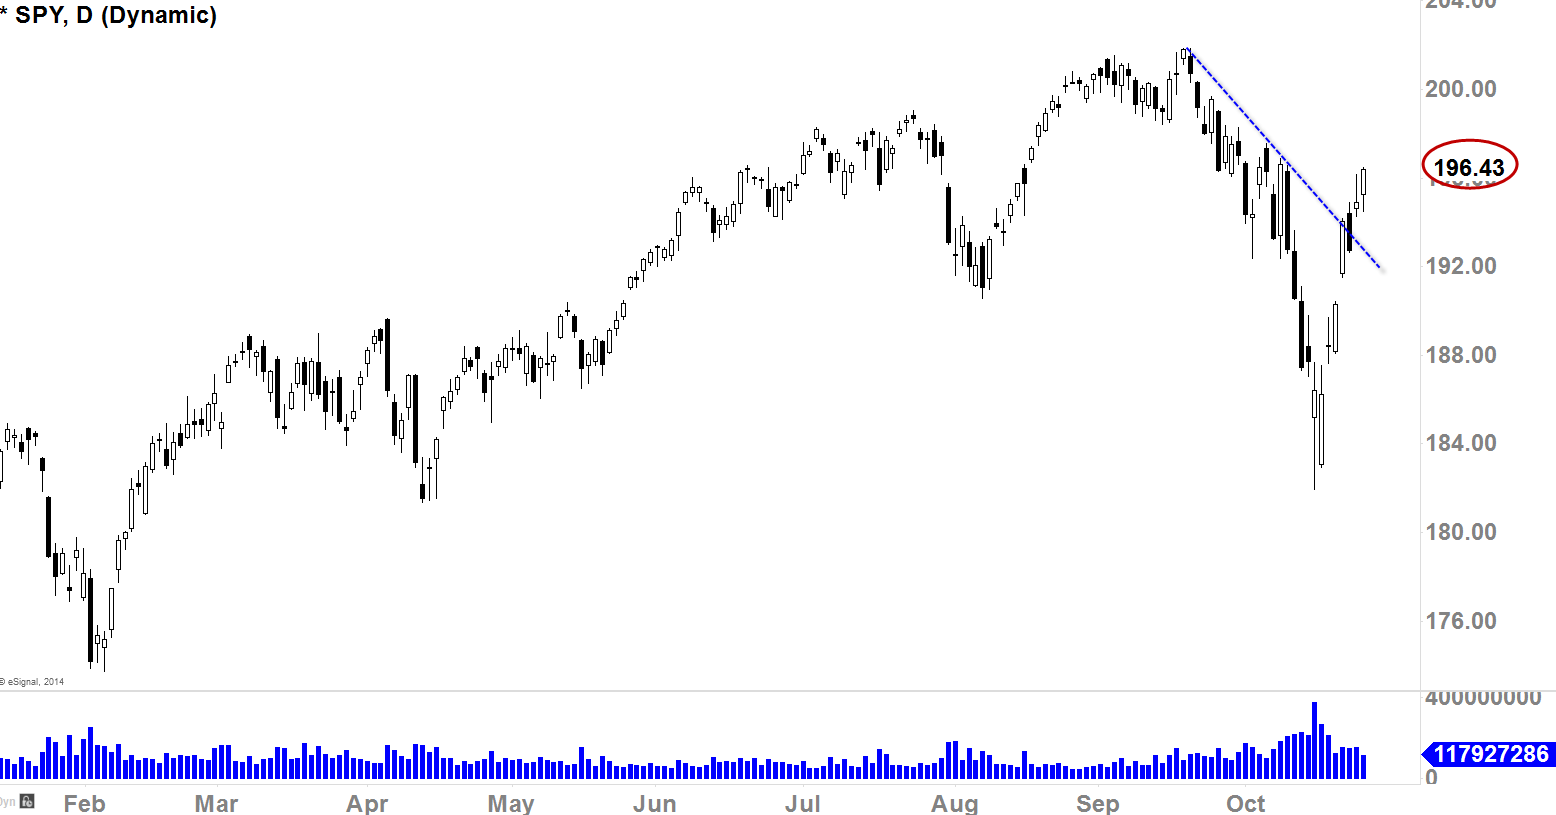
$SPY also cleared recent resistance line after a firm bounce with an ‘Island Reversal’ bottom, and looks to be we can continue to grind higher with potential volatility starts to kick in.
[divider]
[divider]
The Final Push
*Excerpt from the “$SPY $QQQ The Final Push (Part 1)”
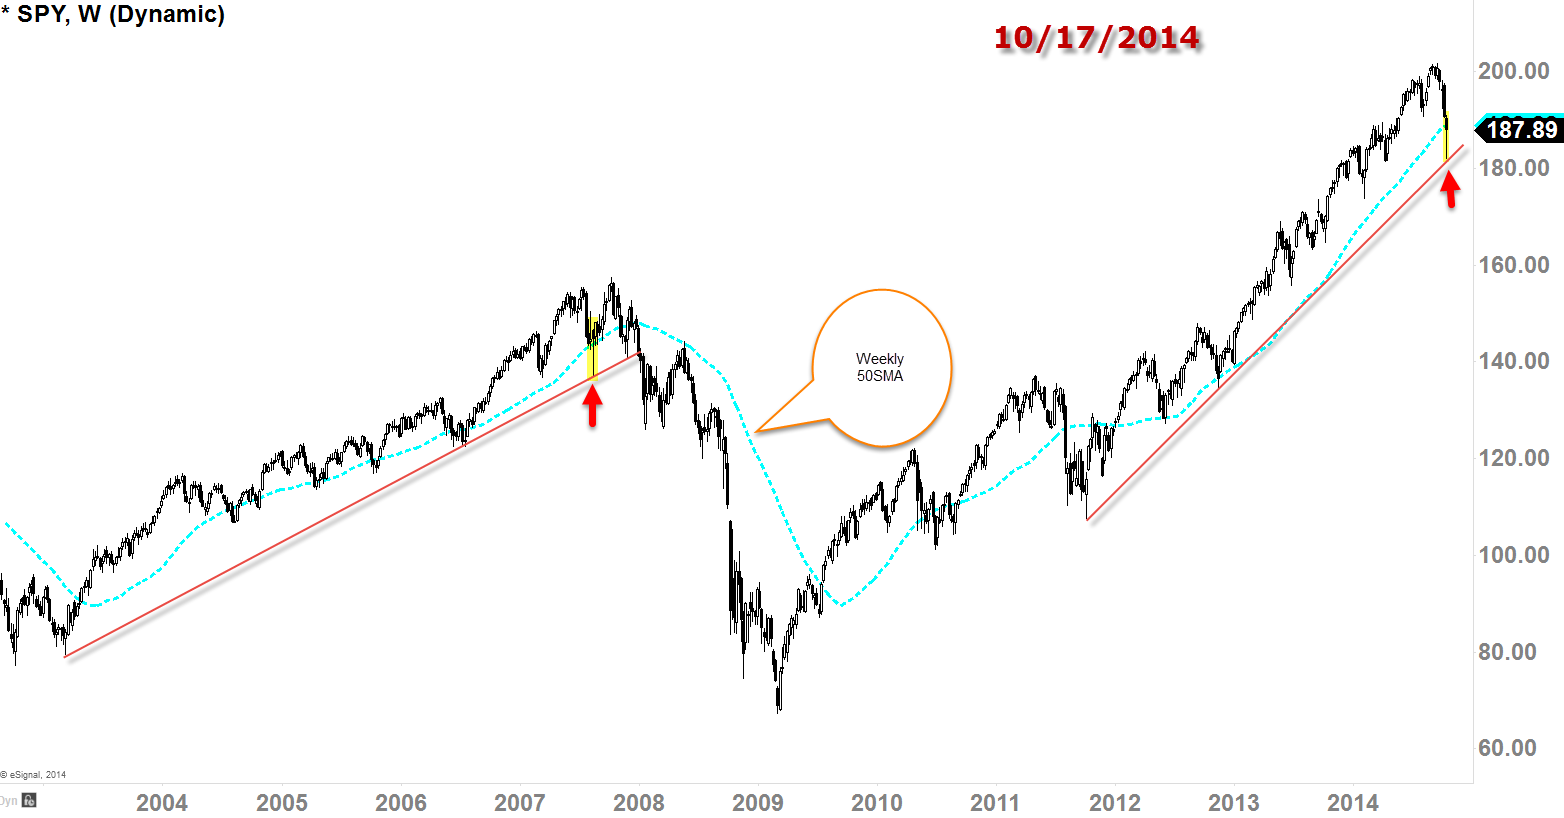
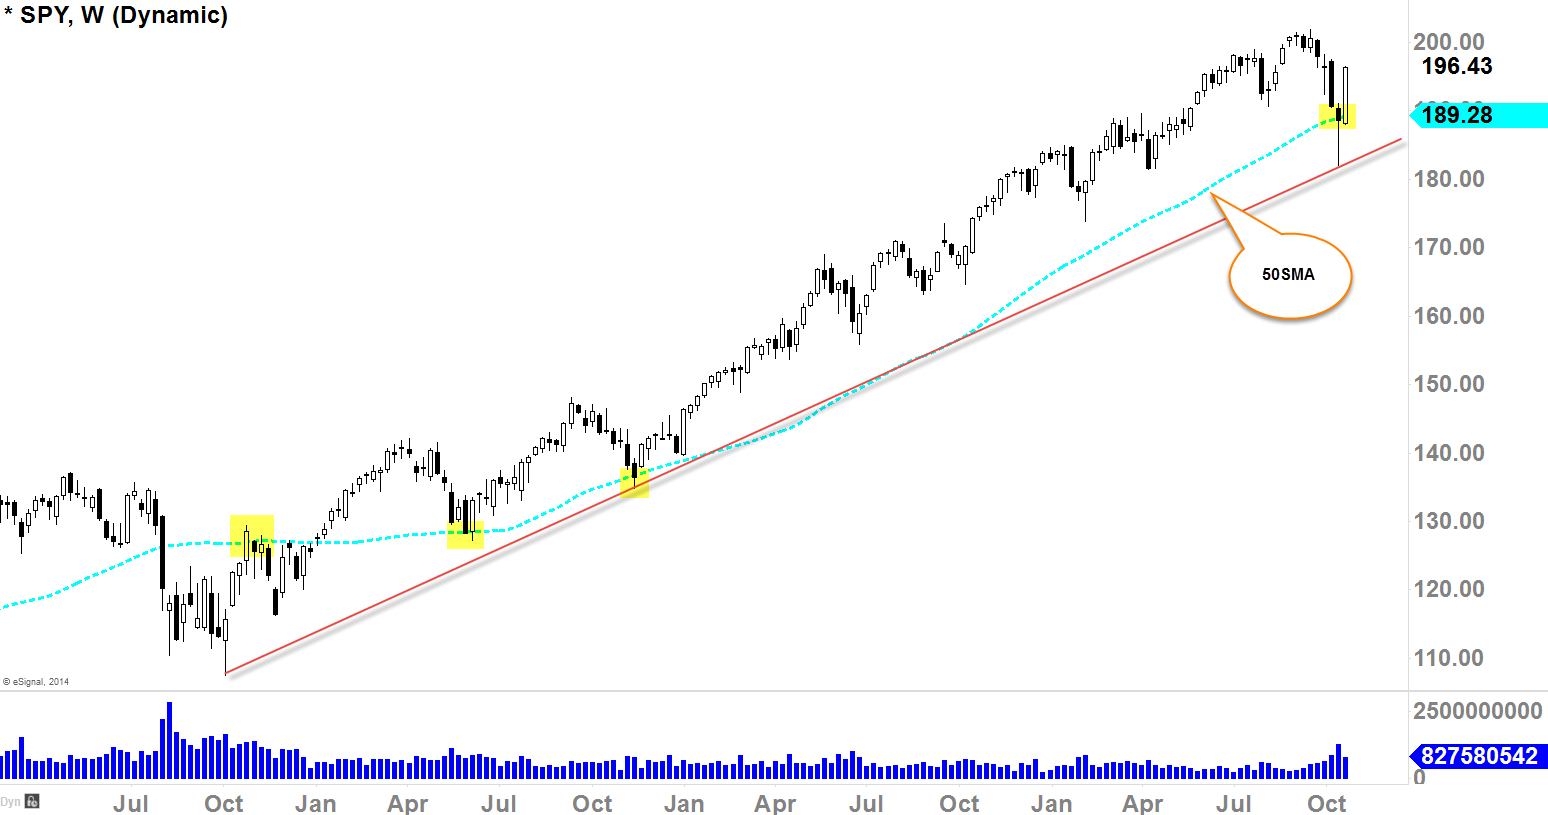
[S&P 500 Index Weekly Chart Screened on 10/17/14 – $SPY]
- Weekly 50SMA continues to act as support
- Long term uptrend support held
- Long lower wick represents Hammer candle (see red arrow)
- Sentiment VERY similar to late 2007
We have been talking about this chart over the weekend thus giving us more confidence of why the market was going to have a bounce this week. But the biggest questions was, how long. If you take a look at the red arrow on the left side of the chart, you can see that back in 2007, we’ve had very similar action with the long term uptrend holding while that weekly 50SMA also acting as support, and not mentioning, that long lower wick Hammer candle right on it (see red arrows)! Today, everything is playing out exactly the same way as it did back in 2007. If we are going to have similar pattern as 2007 forming here, are we going to have one final push to fake everyone out and make new all-time-highs before the MASSIVE MARKET CRASH!?!? Well, we do not know that yet as of today but we will. Like I said before, this market will have to form a topping pattern before actually crashing down, and when it forms, we will know about it. We are also planning on shorting this market if the topping pattern starts its substantiation process, but we also know things aren’t going to happen overnight.
Since the last update, this potential theory has not changed, but again, we still do not have tangible evidence (as of today) to substantiate above hypothesis. When the data is actually there to support the idea, that’s when we will start to accommodate the situation.
[divider]
Weekly Candle Sentiment
*In candlestick analysis, 3 things are must: 1. size of the candle 2. location of the candle 3. volume of the candle.
Facts looking at the $SPY and $QQQ weekly candles…
- Weekly hammer candle (strong & lean)
- STRONG follow through last week
- Hammer was confirmed with a follow through last week
- Hammer was formed and confirmed right on the rising support & weekly 50SMA
- Primary-term higher lows and higher highs are still in-tact (trend is UP)
Observing the facts above, I would have to continue to give ‘benefit of the doubt’ to the buyers as of today, and to me, it does look very strong going into this week. Also, it’s important to observe weekly charts now, because the totality and the scale of this uptrend. It has been in this prolonged uptrend so just doing daily chart analysis isn’t enough with the current climate.
The biggest question is this.. Is this the inauguration of another major bullish run for the next 4-6 months or are the bulls giving it all for the final push? Sometimes you don’t need to know all the answers, but trade the current sentiment.