

[divider]
Related Video
“LIVE Mid-Week Update with Kay Kim [Recorded LIVE]”
[divider]
MACD’s Prefiguration
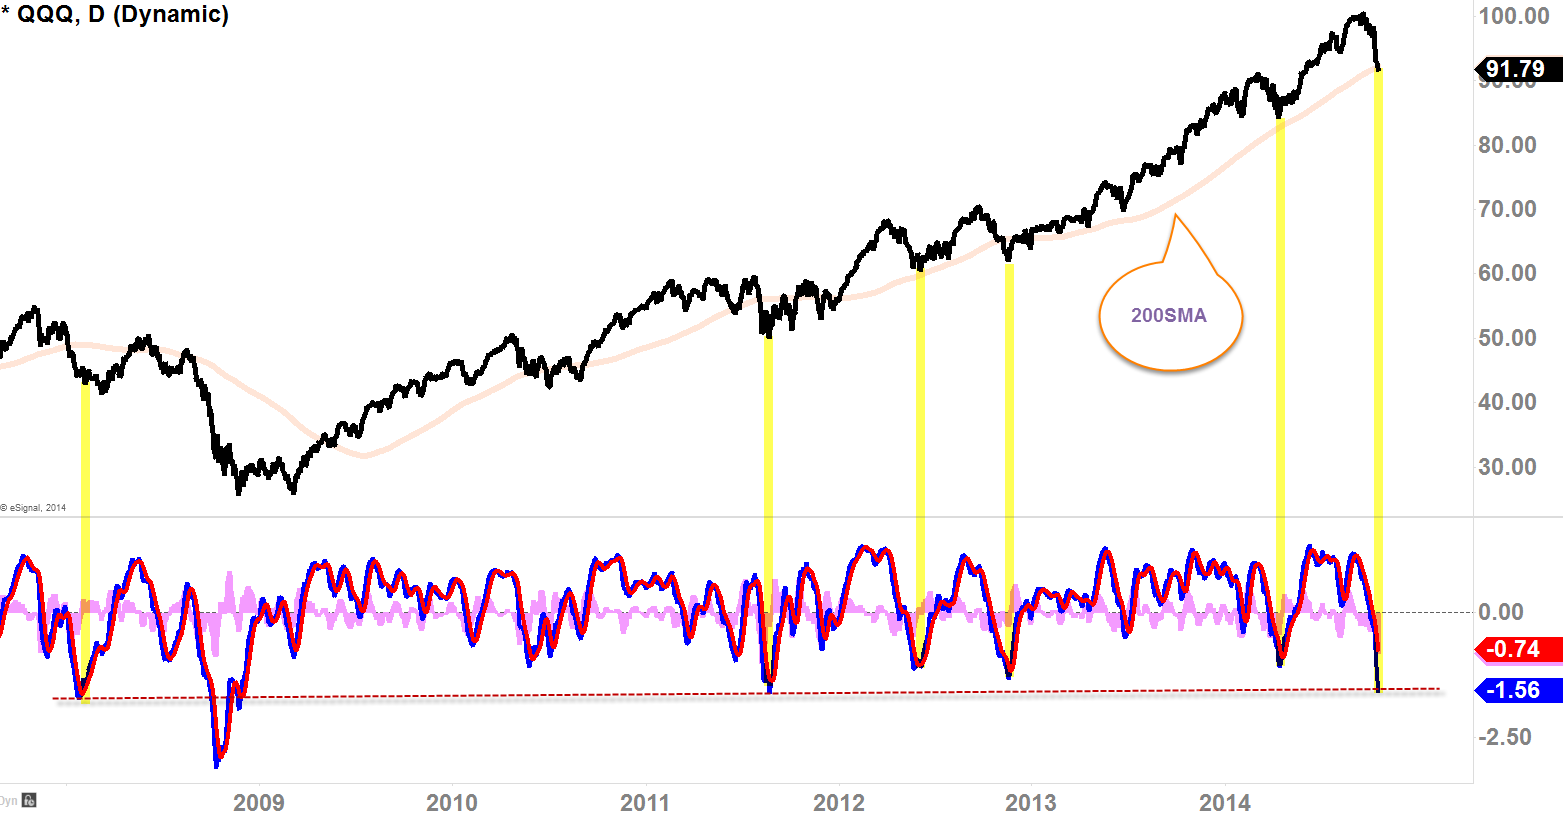
[Daily Chart of POWERSHARES QQQ TRUST]
As you can see, in this chart above with prefiguration of the MACD that, this might the level where the buyers start to prepare for their run-up again, historically speaking. Because as of today, we have insufficient data to confirm that hypothesis but looking at the above chart, MACD does not pass below this level exception of the market-crash back in 2008. Even then (back in 2008), we first saw a bounce at this MACD level and then it formed that lower-high in the price action before the ‘tankage’ occurred while the MACD getting much lower. If you actually expand this chart to 2002, 2008 was the only time where MACD had gotten below this level (see horizontal red dotted-line). So last 12 years, MACD was able to pass below this level only once? I guess my thought is, at this point, what are the probabilities that the MACD gets much lower from this point on?
So historically and probability-wise, I think this could be the important level for the buyers to potentially start to show up. Also 200SMA vicinity has been served as strong support since 2009 and that could supplement the argument here. Maybe next 2-3 days might be the key.