[divider]
6.06.14 Friday
[divider]
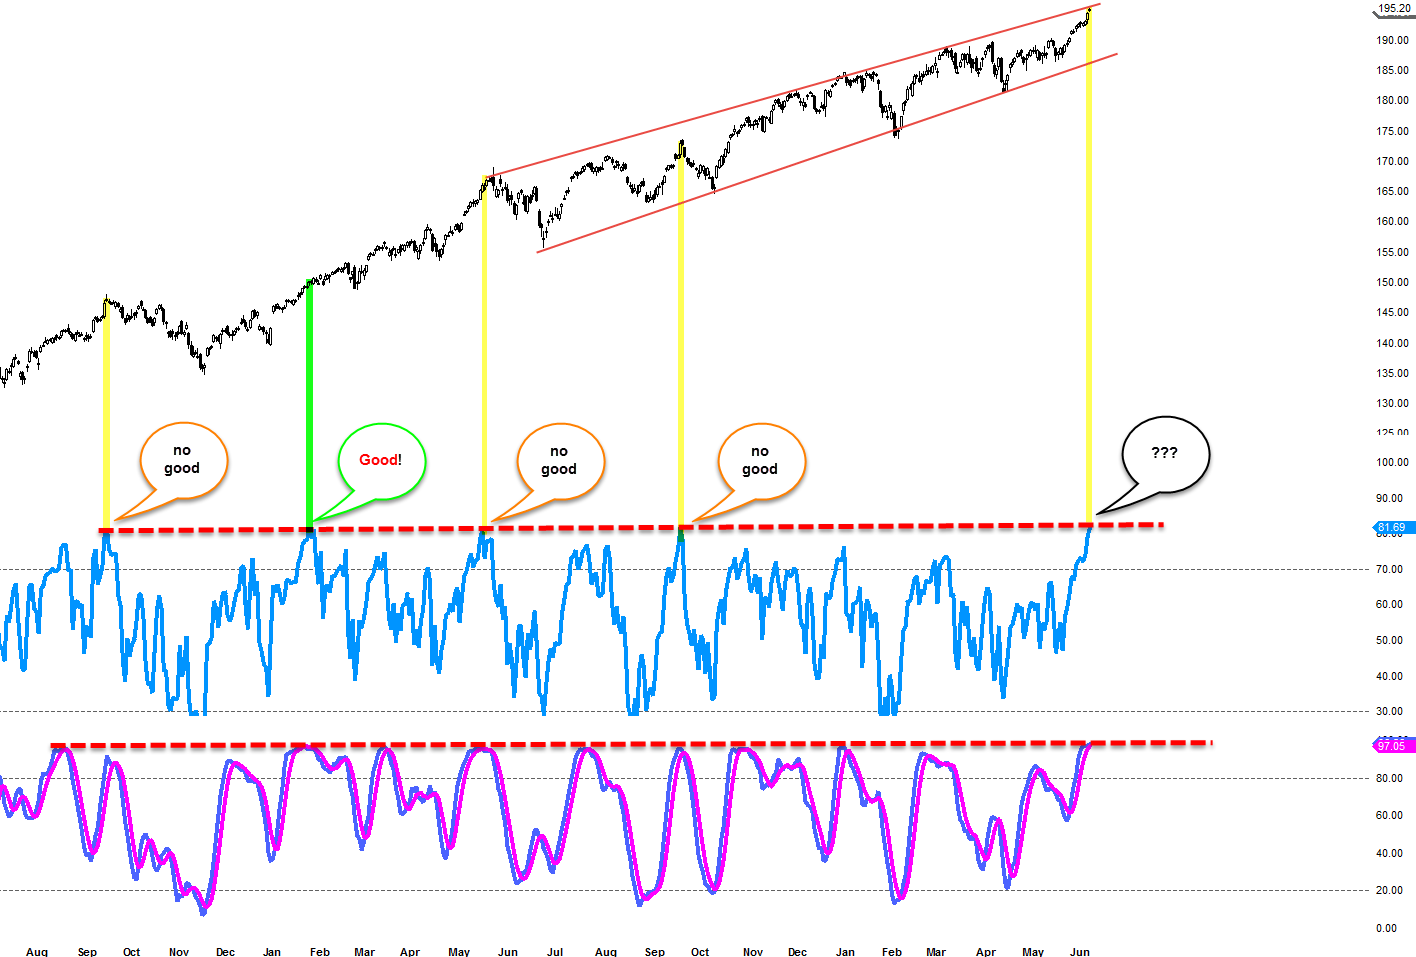
Would You Go Long Here?
Daily S&P 500 ($SPY) with RSI & Stochastic
And no, I did not partake in this recent bullish move but I am not about to start here, neither.
Indicators are “indicators” because they indicate and give us possible scenario. And obviously we all know that this market can do whatever the heck it wants to do but as a trader, all we have is probability. So given that statement is important, I think this chart might be relevant if you are arriving at the party little too late or you have been in this party and enjoyed yourself.
First to note that we are now hitting that rising-channel resistance area. I have to note here again that just because it is hitting that level does not mean it will roll-over. Again, it’s the “probability” thing we have accomplished in our talk just earlier. But when that resistance level is backed up by extreme “overbought” status on the indicators, it’s like a neon sign flaring to pay attention.
Is it possible this thing can just keep moving higher?! Absolutely. Again the “probability” thing is what concerns where we are at right now on the S&P 500, and not, what it can or can not do. So last 3 times out of 4 times when we hit extremely “overbought” status, we did see good size of decline in the market.
I personally wouldn’t ever think about getting long here unless you are very quick day-trader (and I am not and will never be). But hey, if you never cared about this stuff, why start now? =p