
 [divider]
Related Articles
11.07.13 “This is How We Roll $SPY $DIA $XLF”
11.06.13 “LIVE Mid-Week Update [Video Recorded LIVE]“
11.01.13 “Do I Dare to Call?“
10.26.13 “Several Charts 2 Be Cautious $SPY $IWM“
[divider]
11.9.13 Saturday
[divider]
S&P 500 Index
Daily Chart with MACD Hisogram
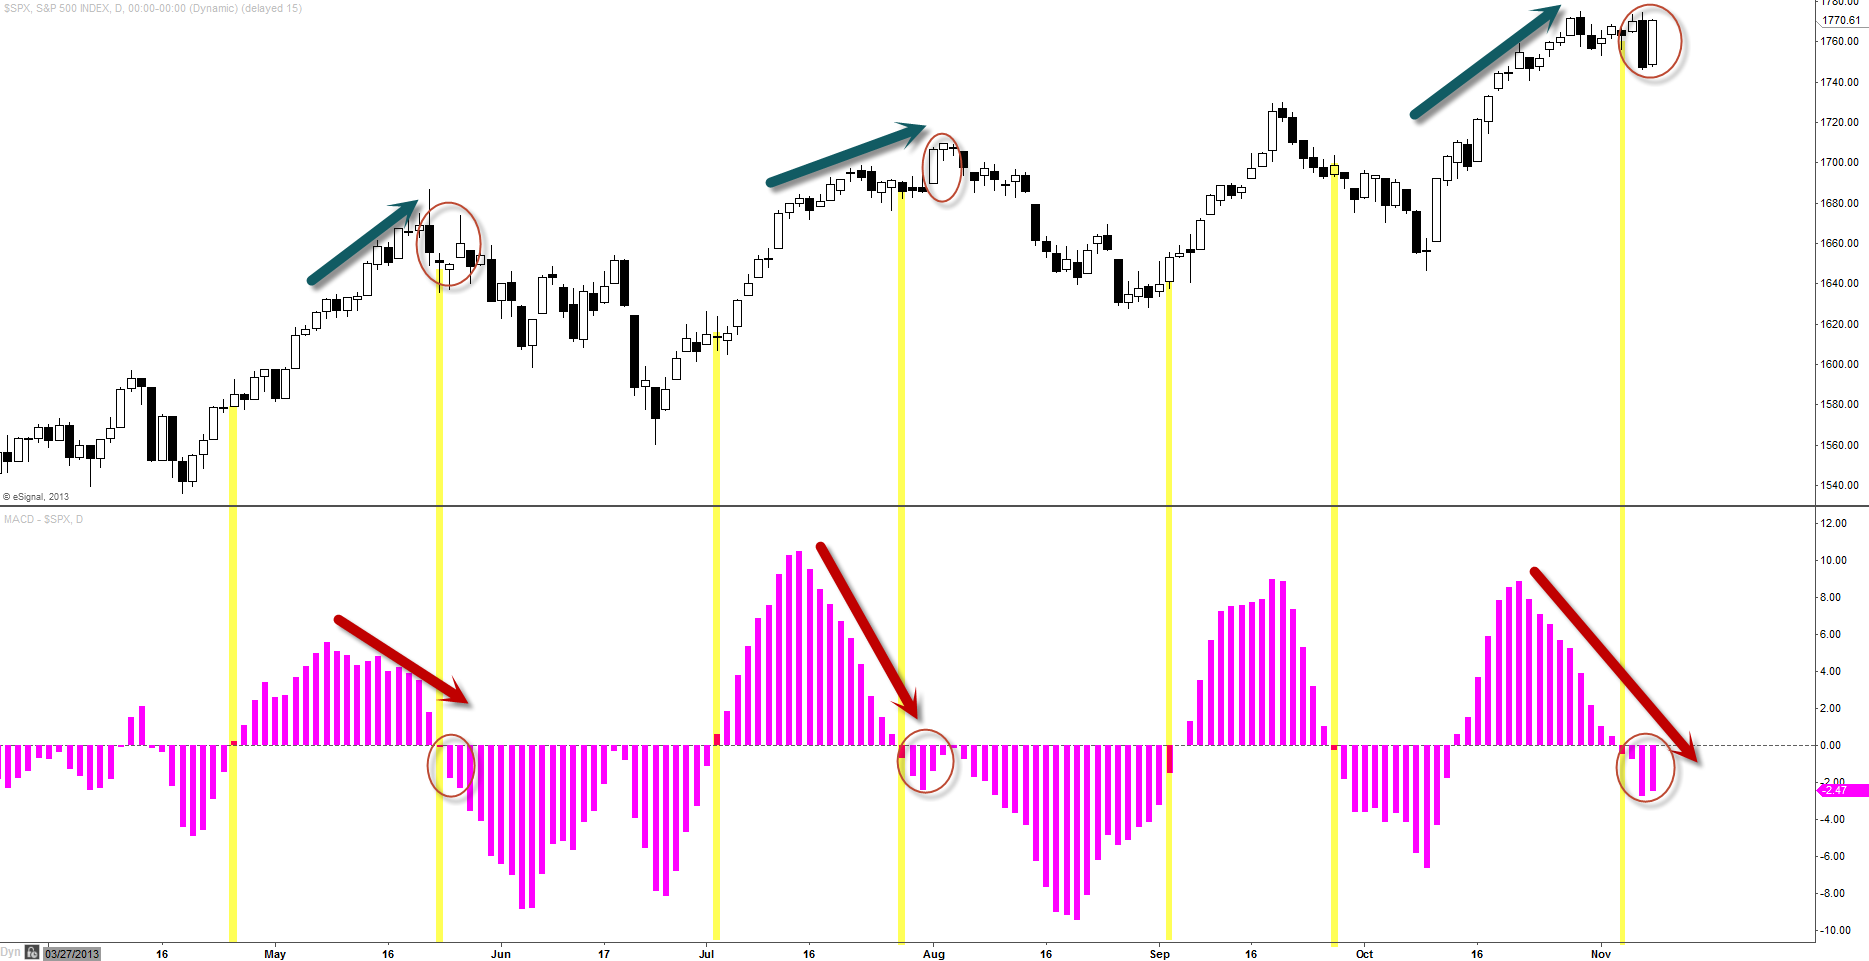
Despite of the Friday’s turnaround to gain everything back from the previous day’s sell off, as we can see, the momentum has been favoring the bears with possible bull trap bounce yesterday.
[divider]
Dow Jones Industrial Average
Daily Chart with MACD Histogram
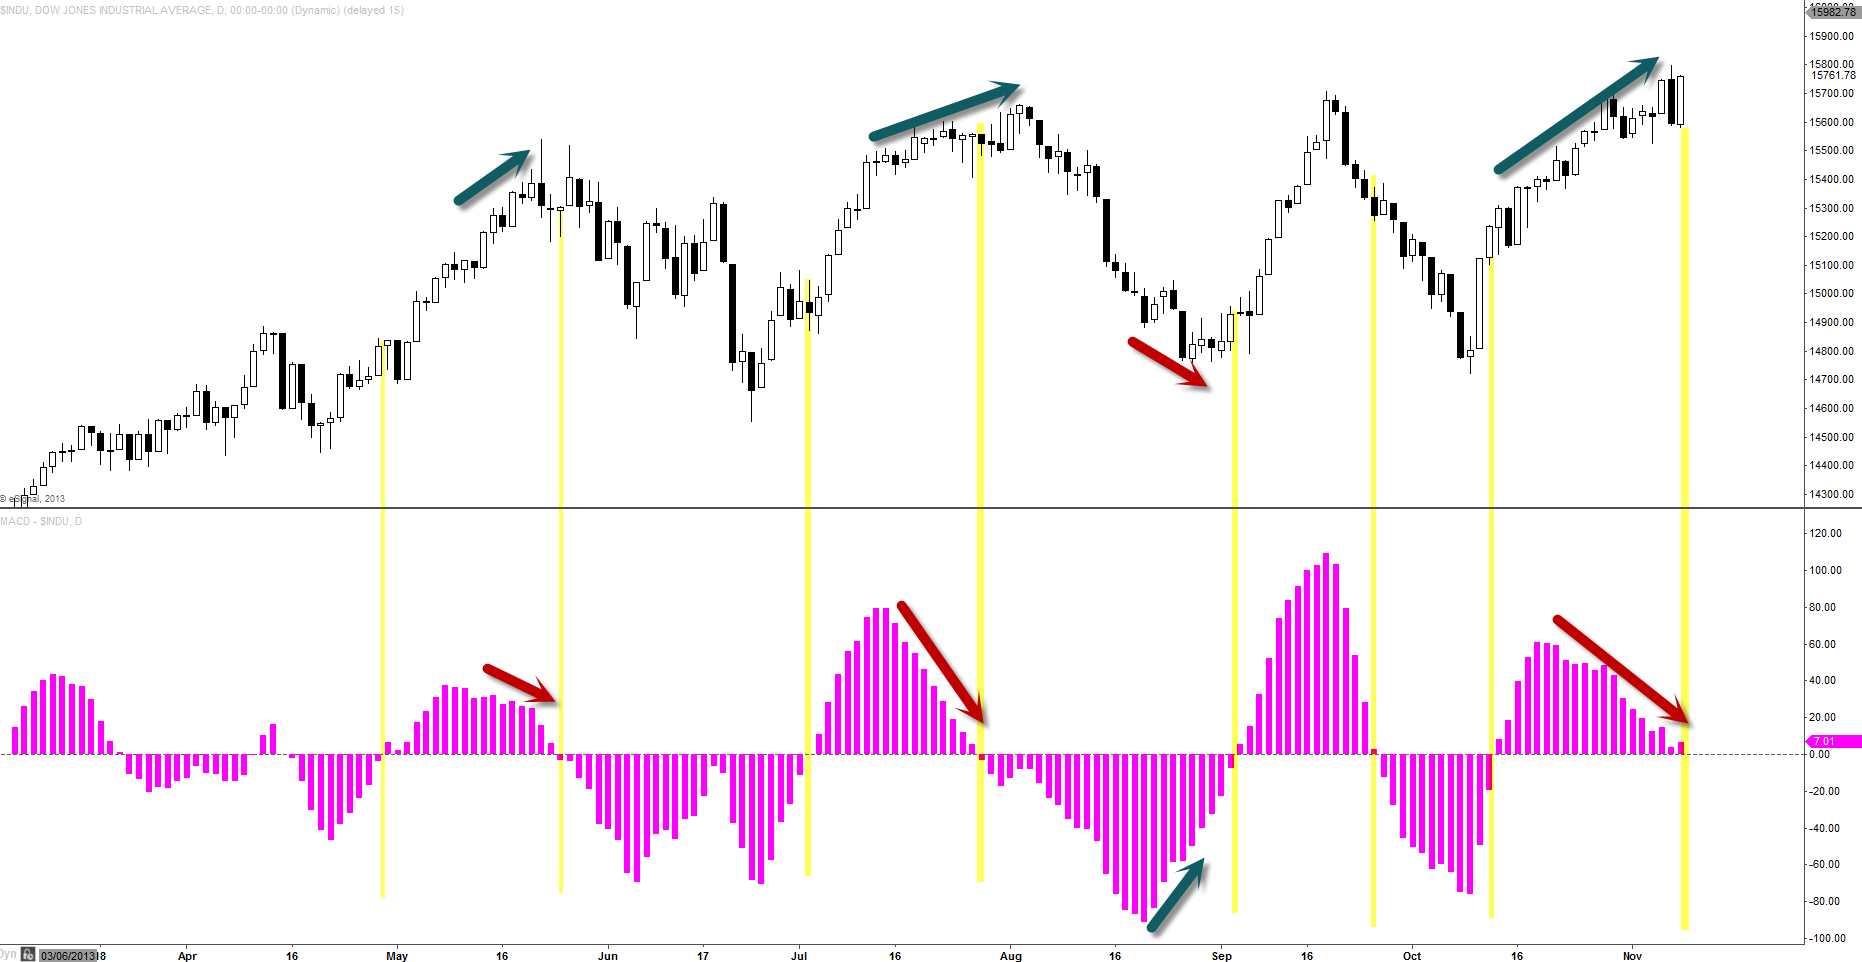
Looking at Dow Jones, we do not have MACD Histogram crossing below the zero line yet but the momentum has been slowly depreciated. Once this histogram crosses below the zero line, would have to assume that the momentum could continue to decline thus making this index to deteriorate.