
Weekly 100SMA & Fib
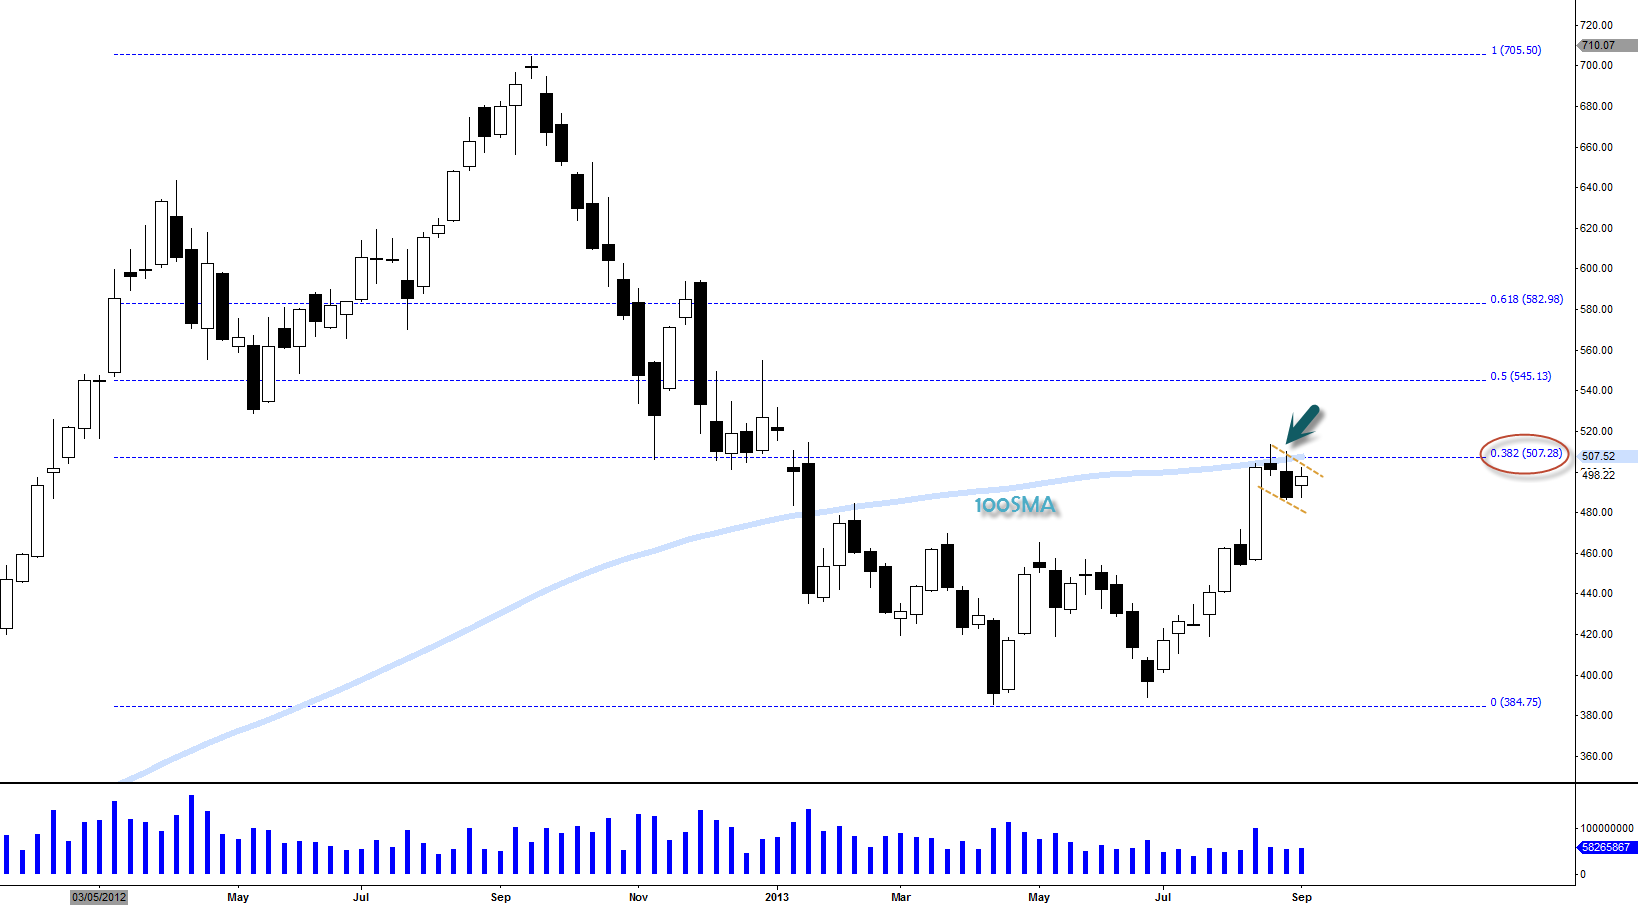
- Weekly 100SMA has been acting as resistance last three weeks
- Fib. 38.2 level also confirmed that level as resistance
- Currently forming bull flag
Looking at the weekly chart, as of today, it does look more bullish as we are possibly forming this bull flag pattern. Obviously we would need to break above the fib level and 100SMA for a confirmation but as long as sellers can’t truly push this thing down and the stock hangs around, I do think we could have break to the upside in a week or so.
Daily Pivots
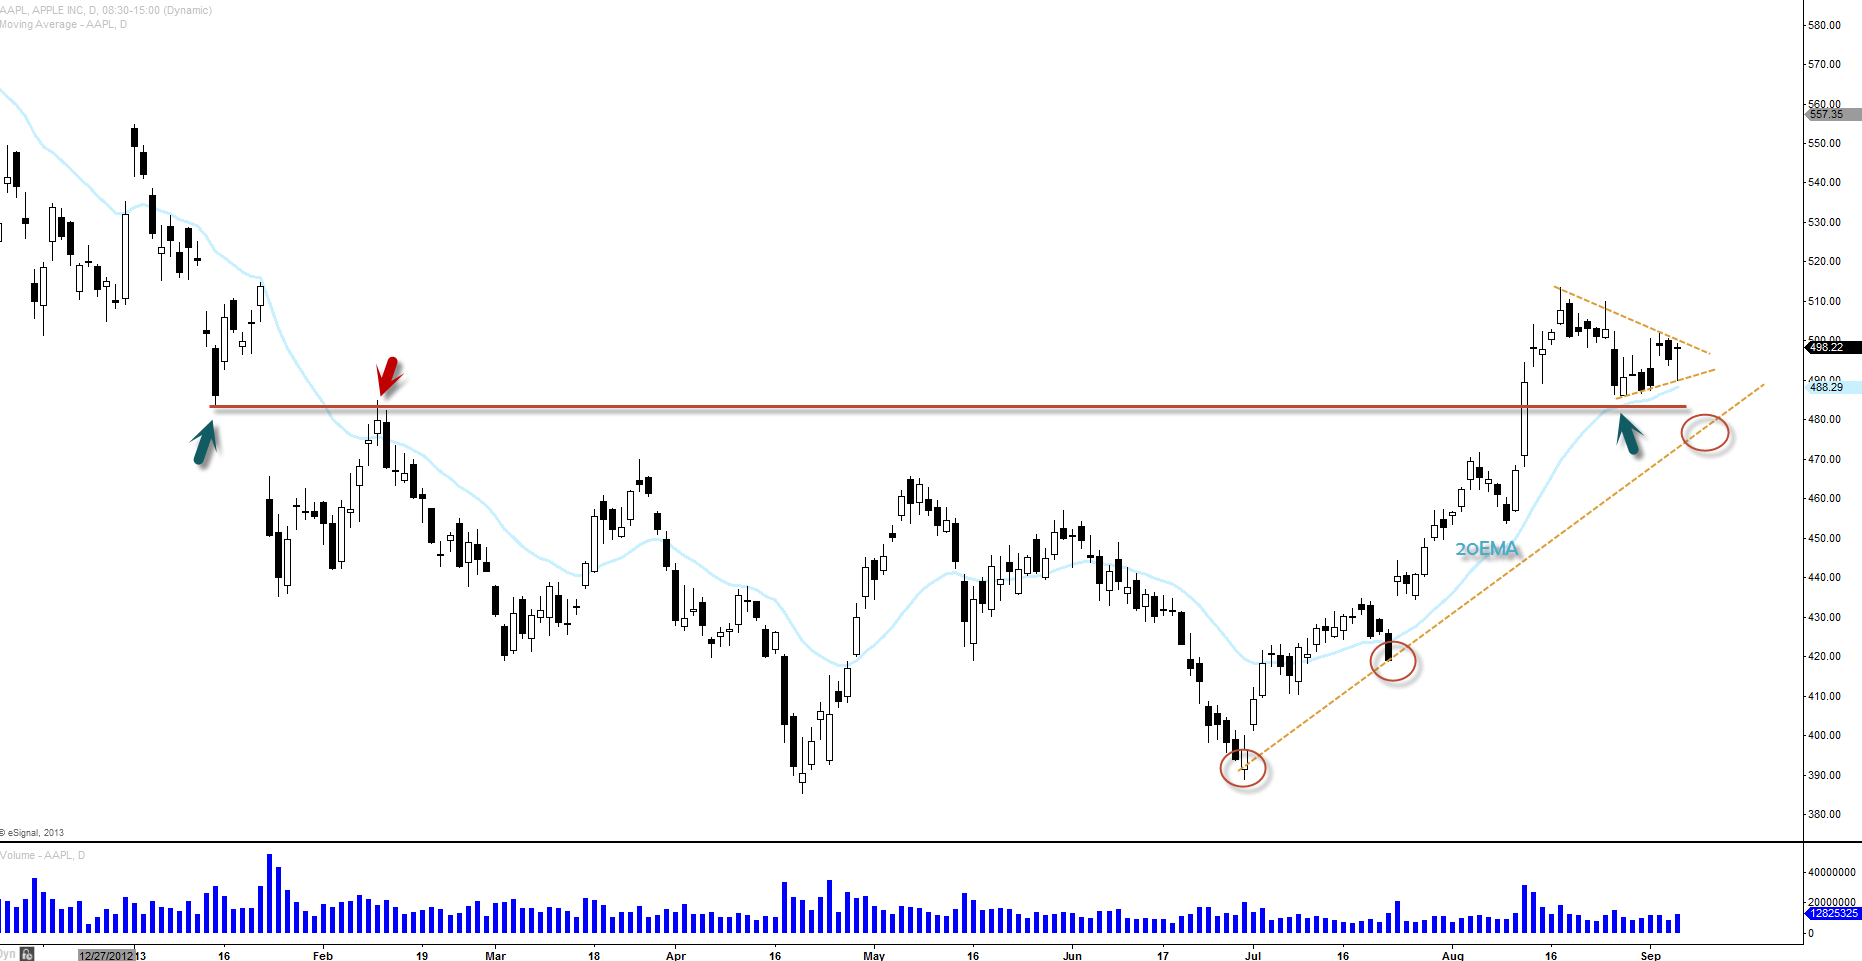
- $486.50 is continue to act as solid pivot and we are still above that level
- 20EMA also continue to support this move to the upside
- Possibly forming bull pennant pattern
Also daily chart starting to look more and more bullish as we are consolidating above this pivot level. If you look at my yellow dotted uptrend line (see circles), I am wondering if we can come down to make that higher low right on that uptrend line. Also I’ve been talking about how $470 level might be the good level to come down before going higher and I think that still could play out (thought I think $475 might be more doable level) but if we breakout from the bull pennant pattern, I think we might not have to.
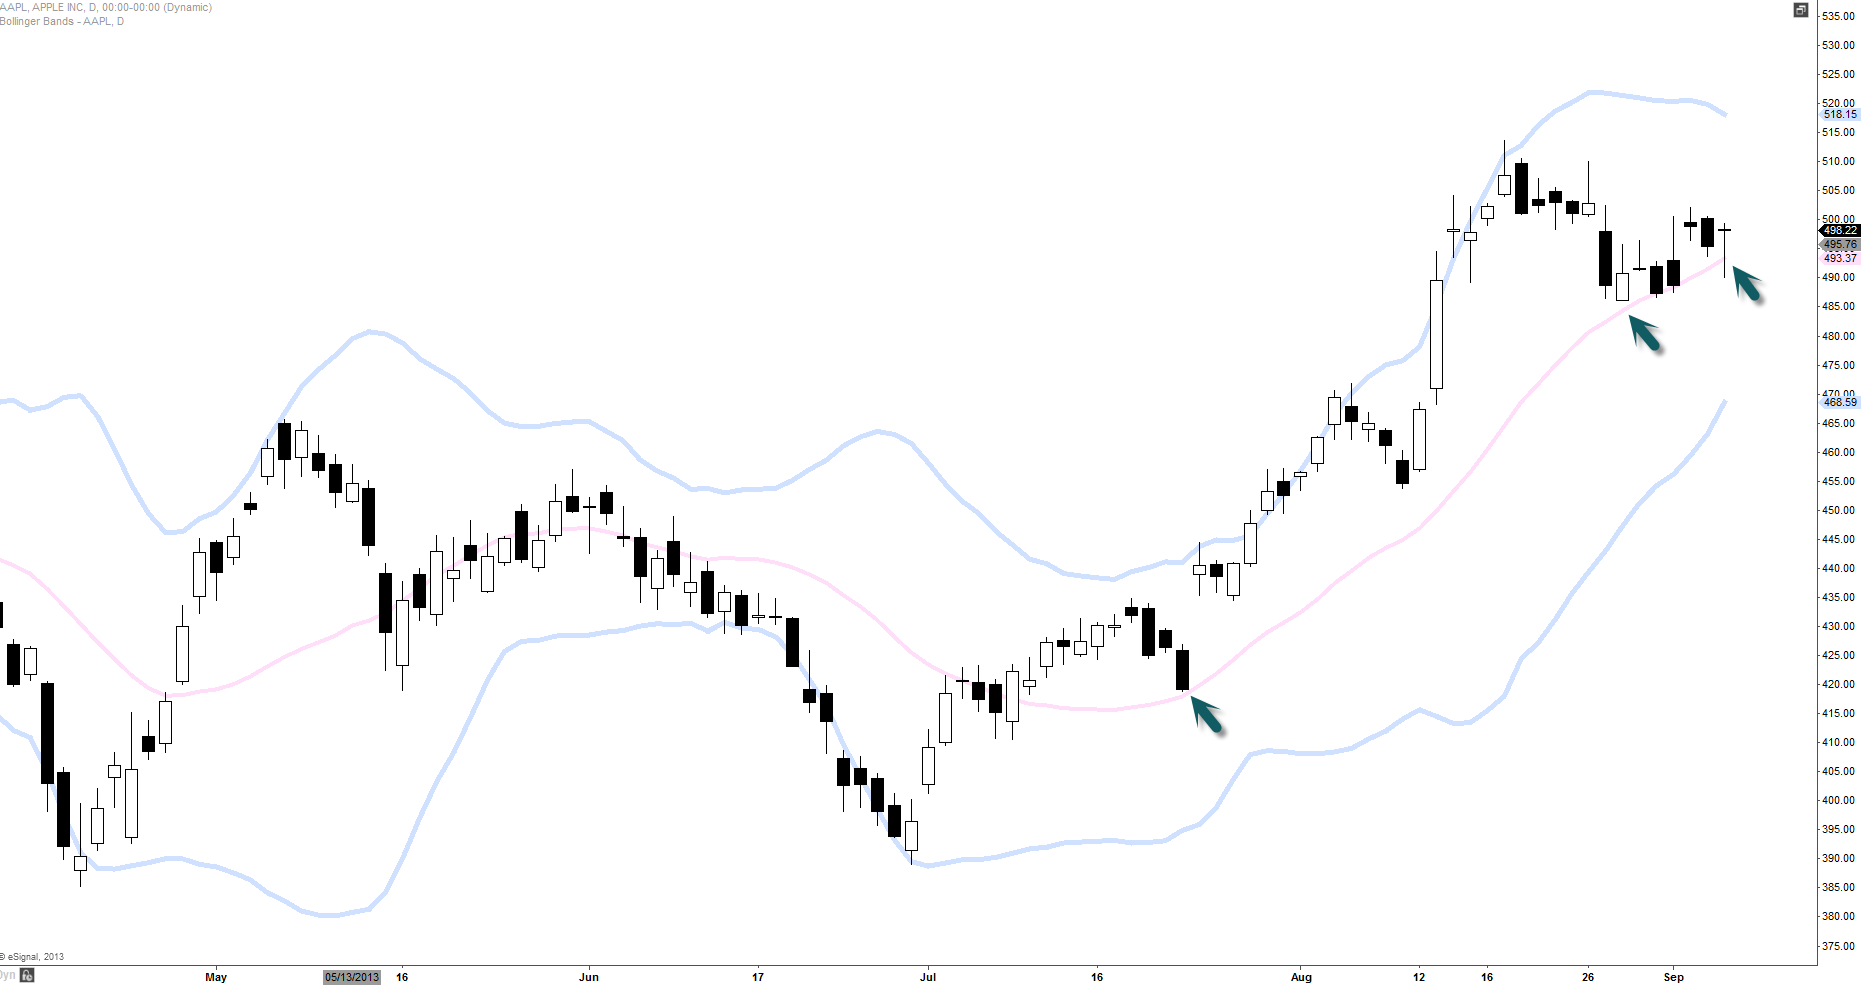
Bollinger middle line (20SMA – daily) is continue to act as support for now and it definitely adds some flavors to the bullish argument.
[divider]
Final Thoughts
I am currently not holding any positions on $AAPL but I am thinking to possibly go long if we do break out of this bull pennant pattern on daily. I still think about $475ish level is bit more attractive to go long but I would let the chart dictate that. I would also pay attention to the broad market and I would feel much better to go long if the whole market is also moving in that direction.


