
Last Update: 8.22.13
8.13.13 Tuesday
[Morning] Entered Calls @ $472.50

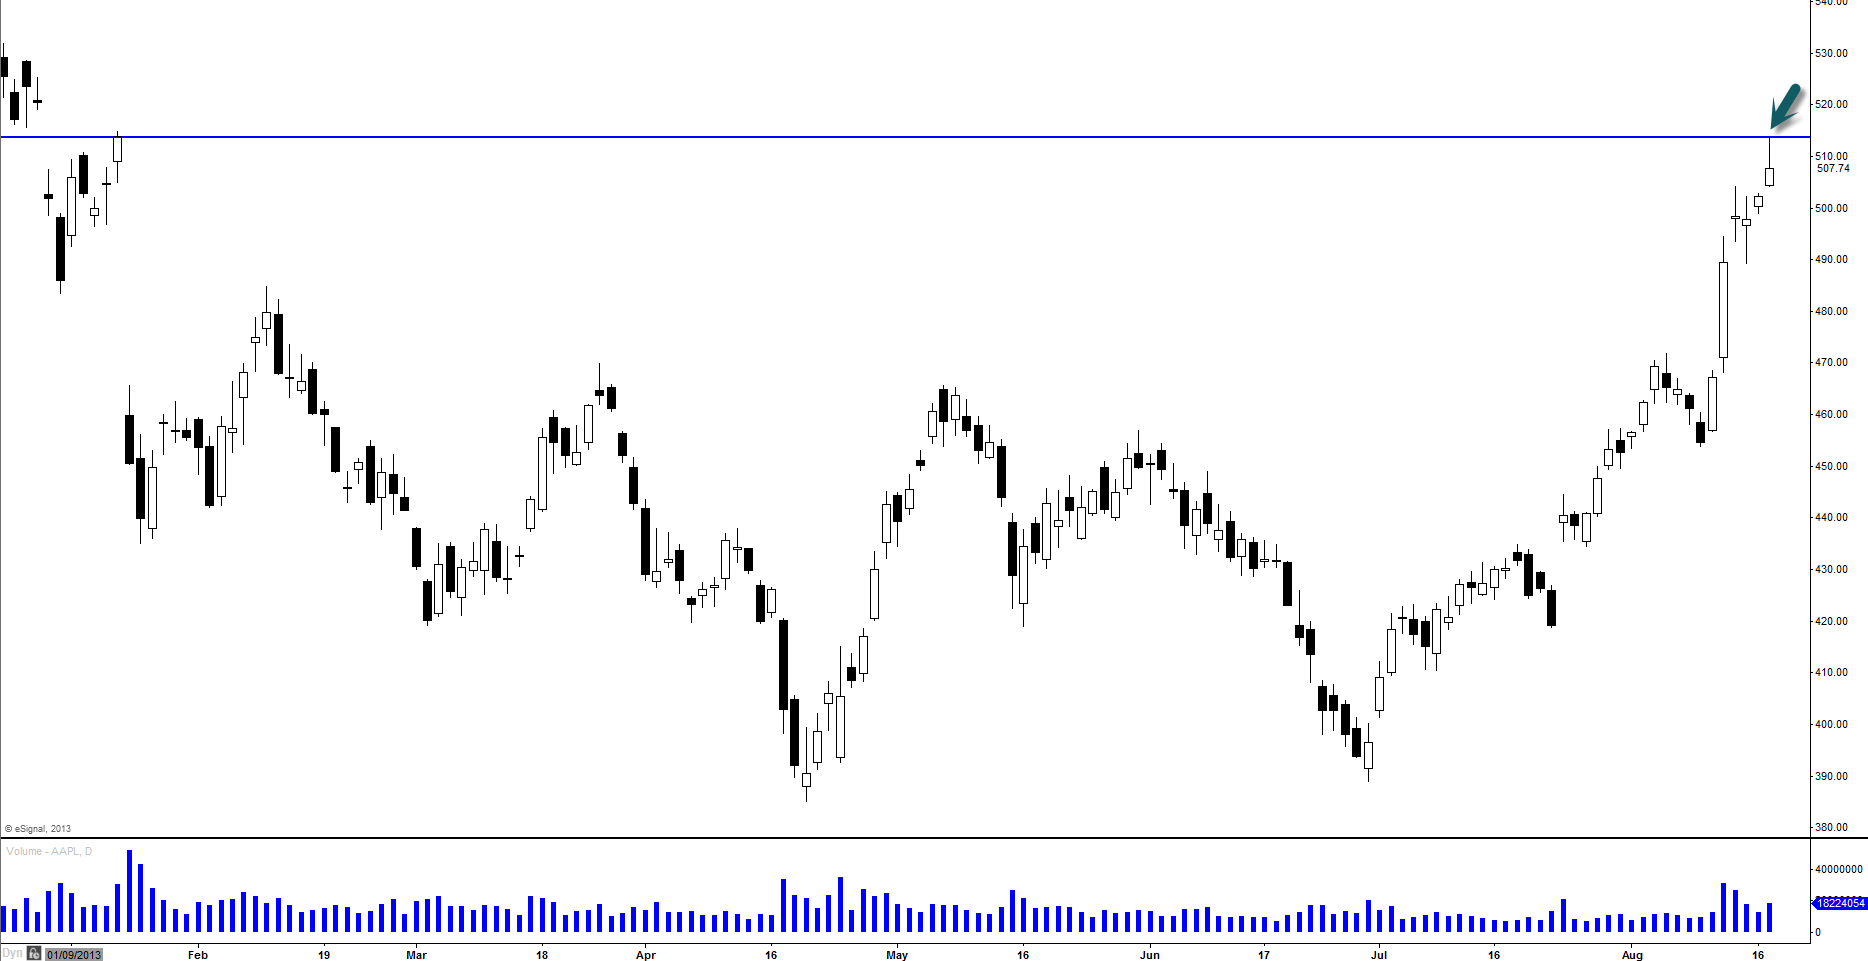
Yesterday, we broke out of bullish flag with great volume and this morning, we gaped up above the recent resistance level. I waited for about 30 mins this morning for it to pull back to get a little bit of better entry here. This was also the level where 200SMA was residing so definitely it was the level to watch out.
[Morning] Added More Calls @ $468.29
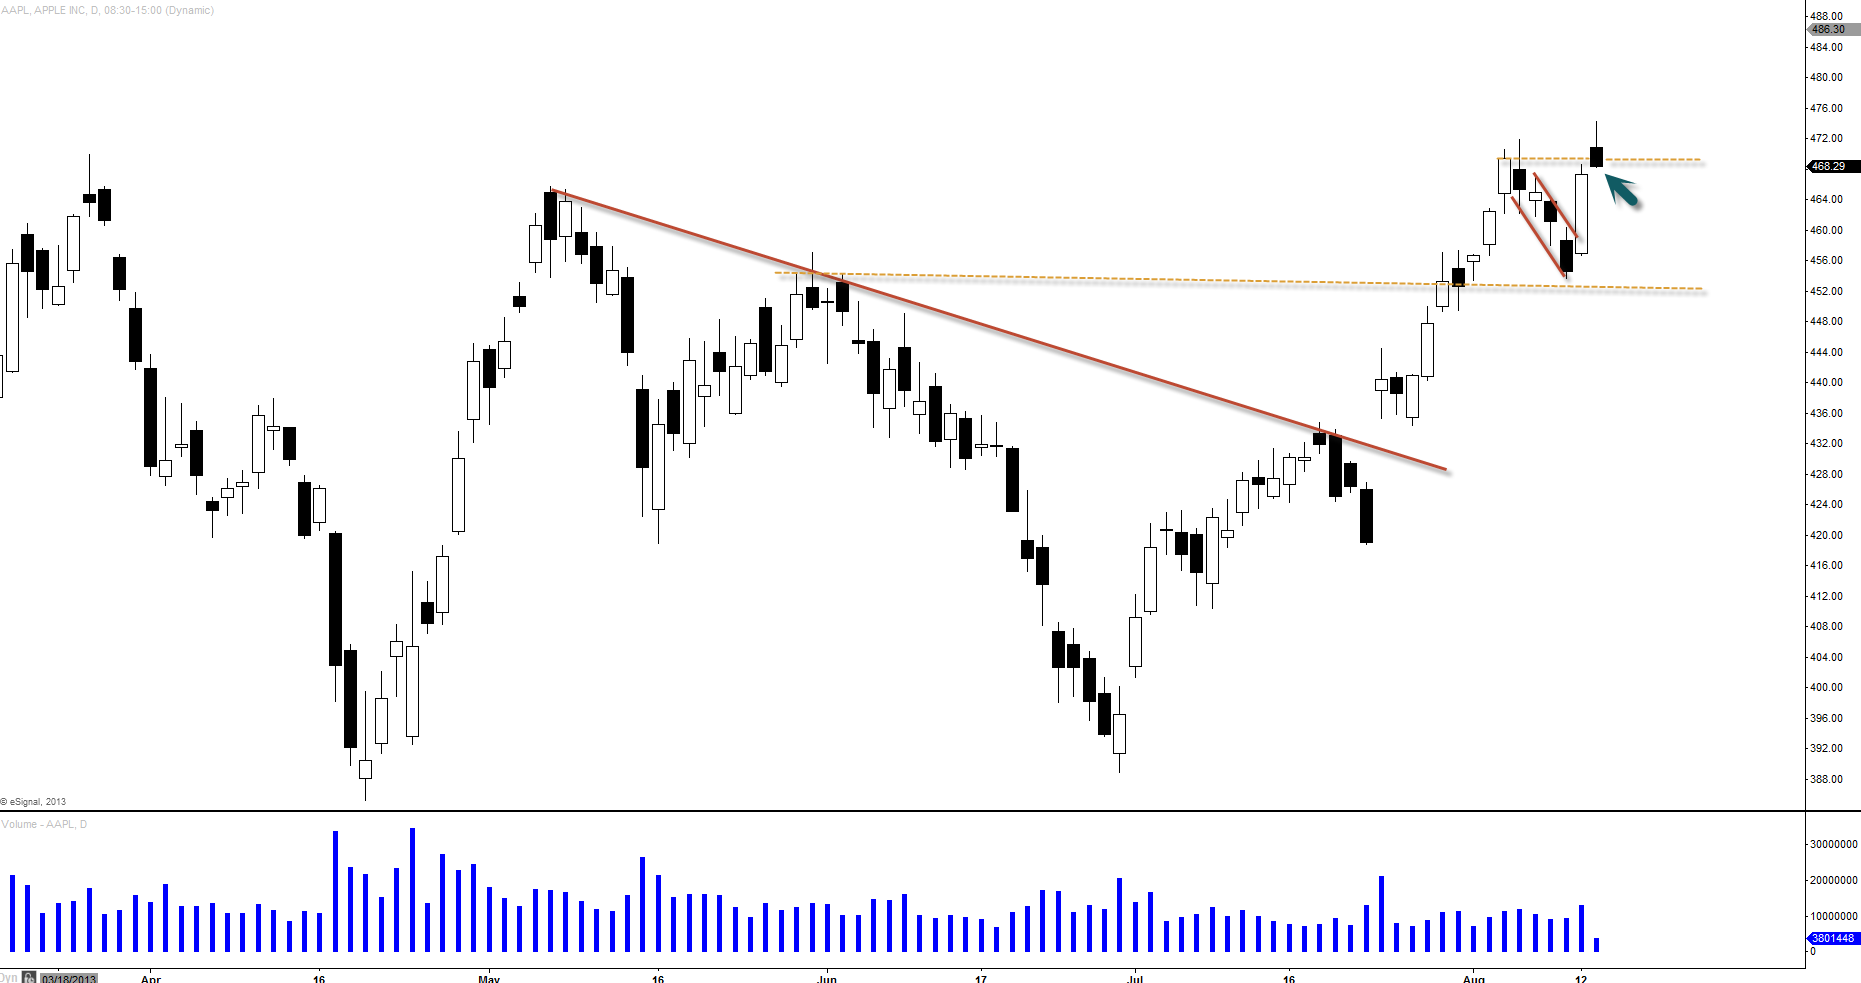
After about 1 hour in after open, $AAPL started to pull back more as the whole market started to come down hard in the first hour. I could see volatility through out the most of my stocks that I was watching and sure enough $AAPL was also seemed as though it was falling down hard. I decided to add more calls at this level to play that fear for my advantage and knowing that the bull flag breakout continuation play can still be played out here.
[After Close] Exploded
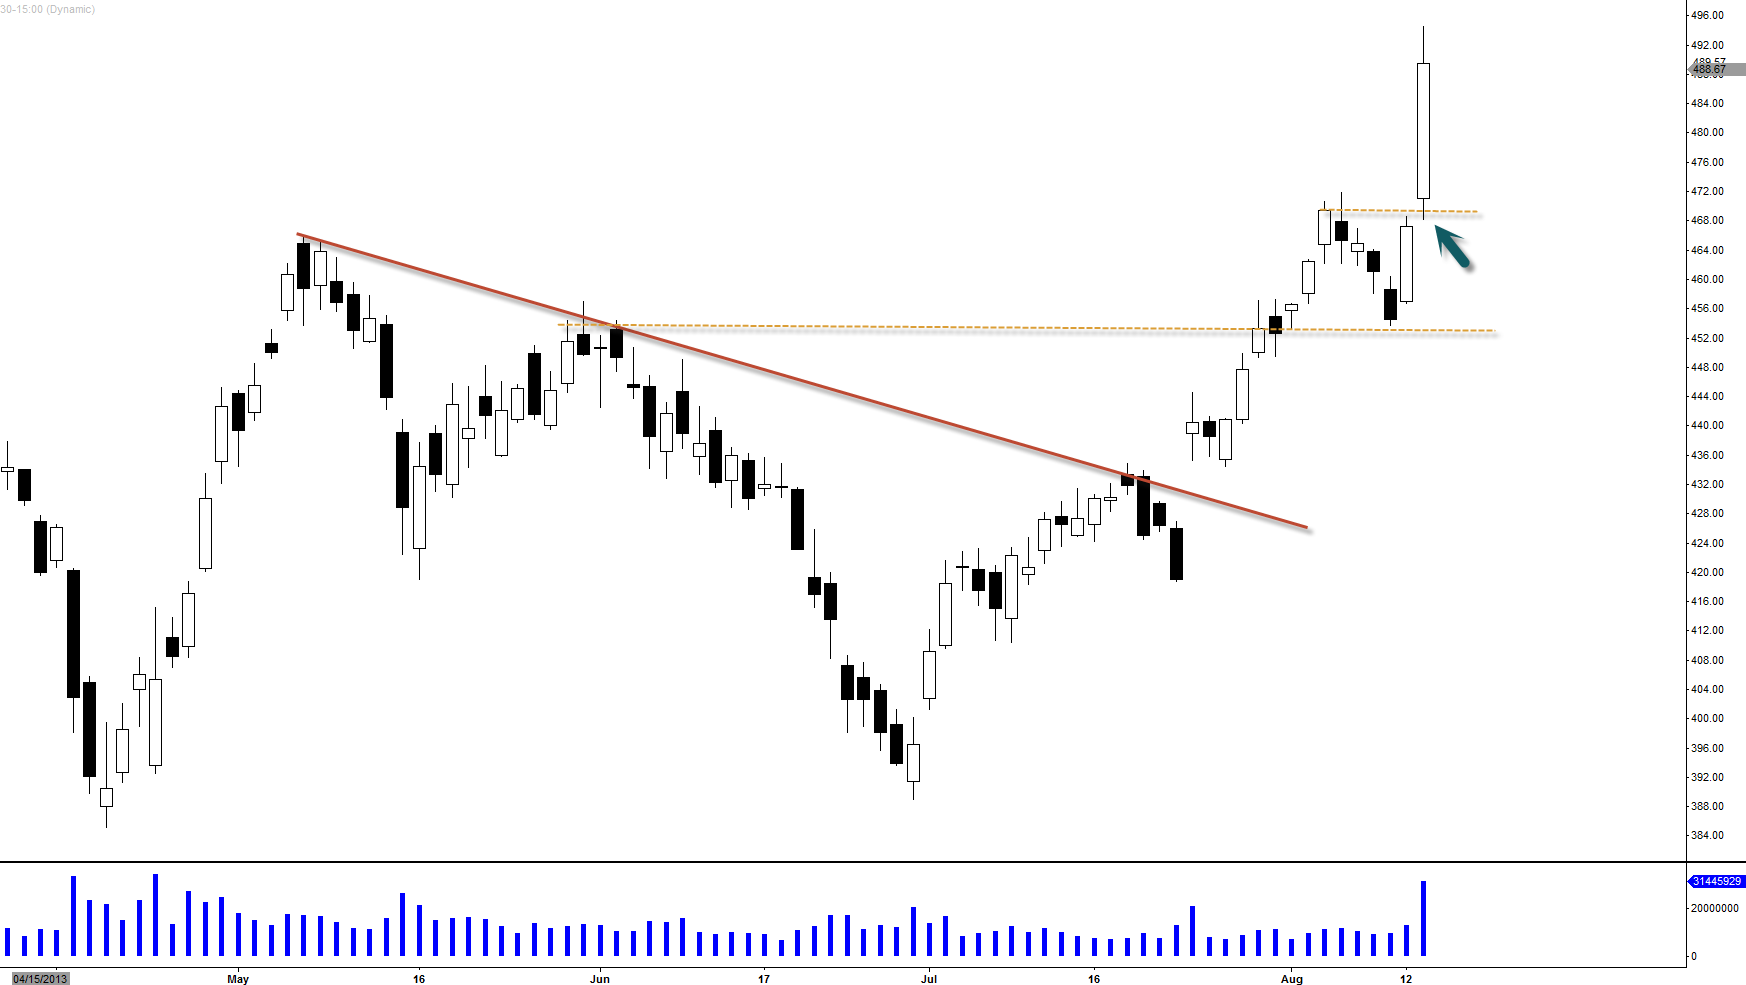
$AAPL exploded today. Looks like it wants to fill that entire gap to the upside and next target about $510.
8.14.13 Wednesday
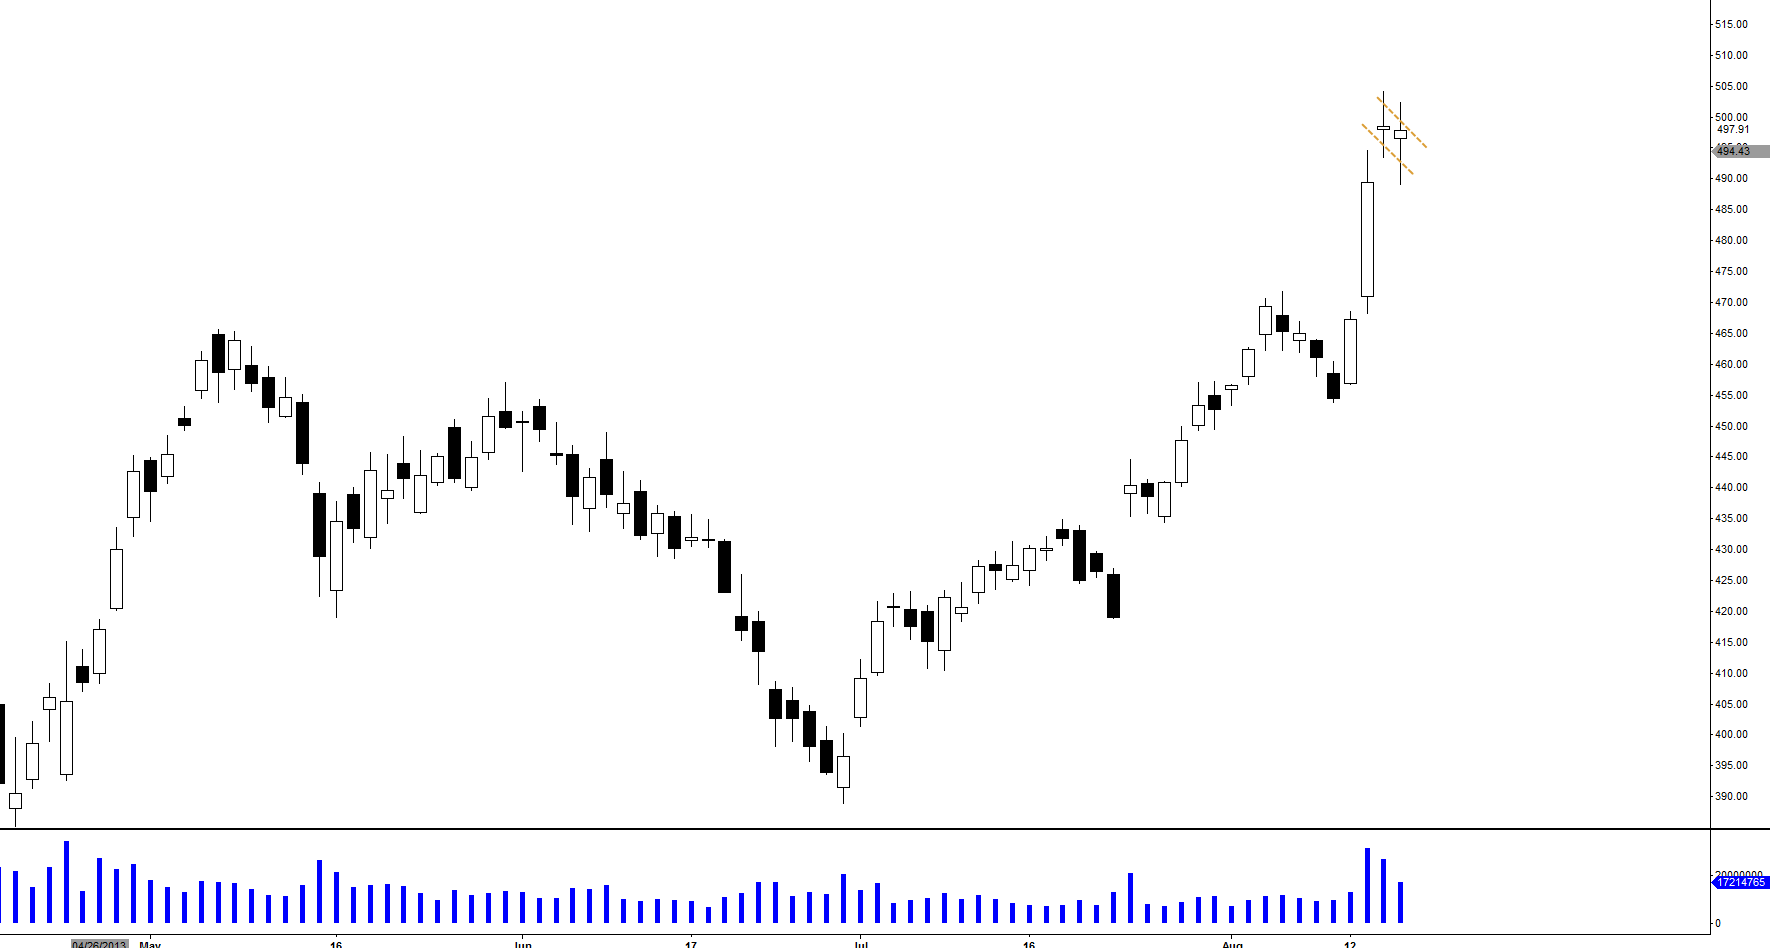
[Before Close] Closed 60% Call Positions @ $501.65

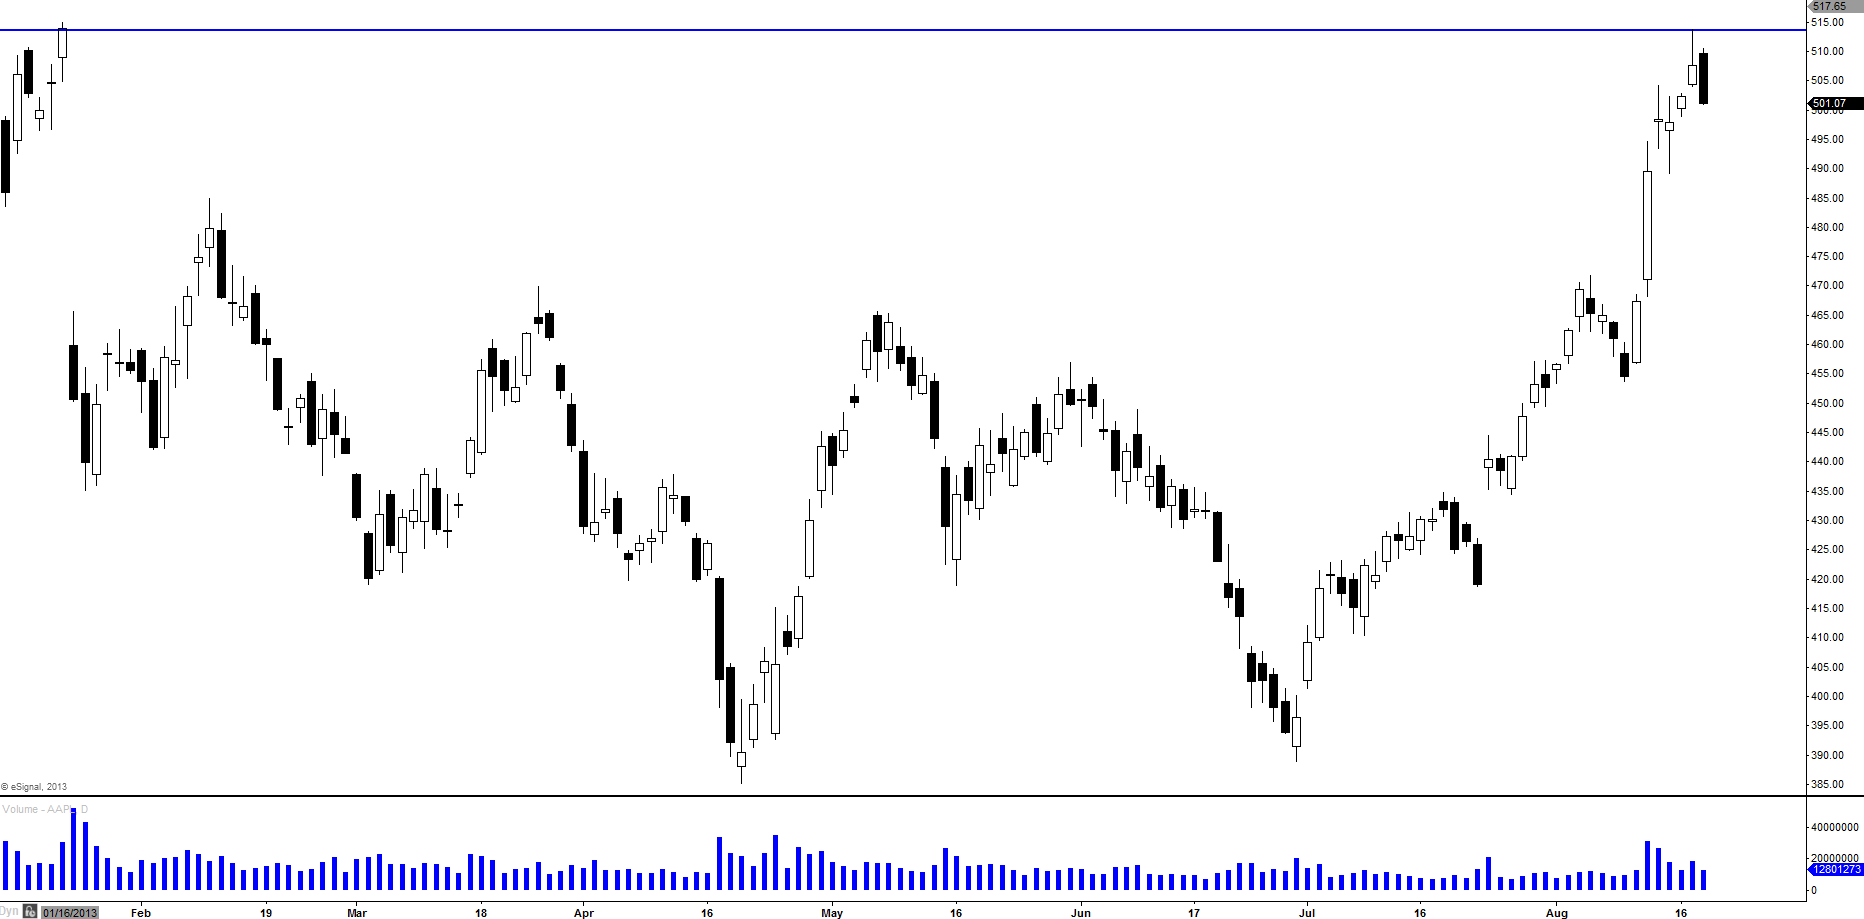
I don’t like moves that are all wrapped up with hype and emotion and that’s exactly what we are seeing on $AAPL. One of the reasons is because it could also come down that much fast so I decided to take some profit about 1 hour before close today. If you look at your end of the day chart, we have a doji but not just normal doji but doji after gap up this morning. This doji can turn into evening star reversal if it gaps down and flush so definitely warning signal there but nothing has been confirmed because this doji also can turn into bull flag or bull pennant. We will see tomorrow with more clarity.
8.15.13 Thursday
Looks Like a Bull Flag
I am still holding my remaining call positions as I think we are still in this bull flagging continuation pattern. It’s impressive the fact that the broad market was extremely bearish today yet $AALP stood strong. I don’t remember the last time we’ve seen $AAPL with this kind of strength. I wouldn’t be surprised to see another day or two of flagging/continuation pattern before another leg up. It still looks very much attractive for higher prices in my opinion.
8.19.13 Monday
[Morning] Closed 50% of Remaining Call Positions @ $512.04
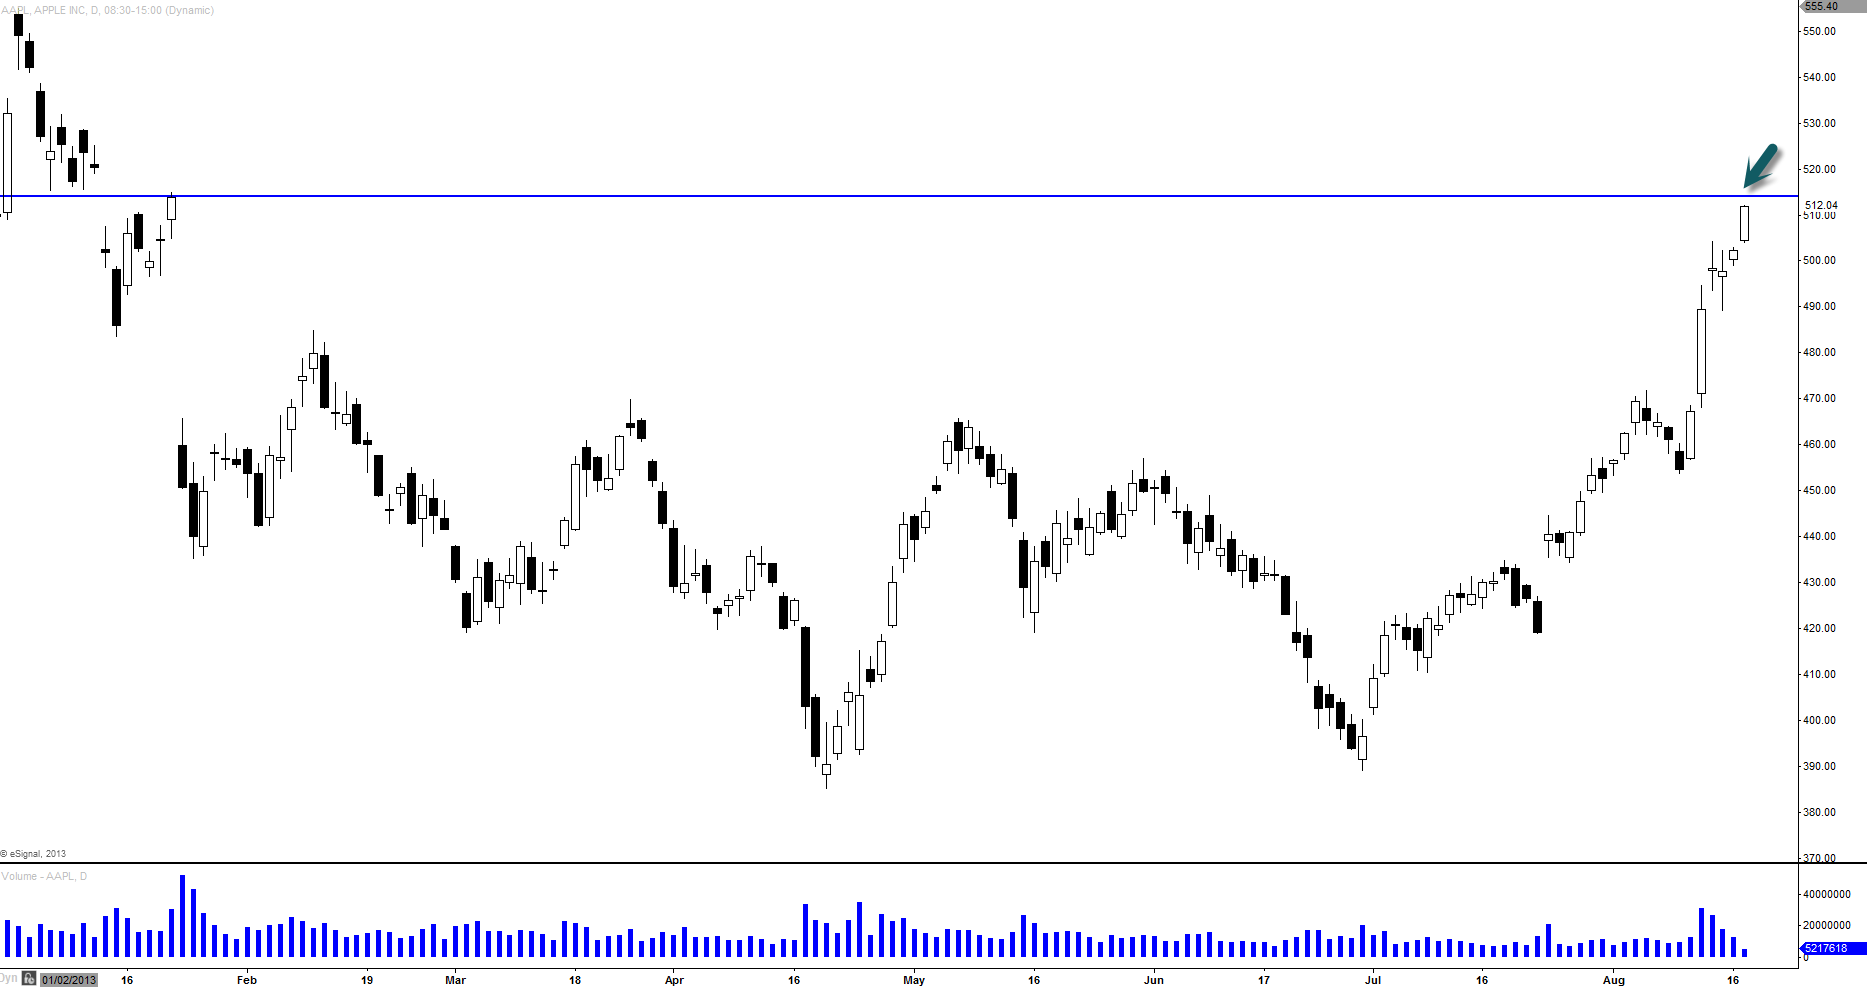
- Major resistance level from 1/23/13 @ $515ish level
- Weekly 100SMA residing right at this level
- Declining volume
[After Close] Shooting Star Reversal
Well I am currently holding very small positions as I have been closing my call positions. I guess I am glad I was able to close most of it out earlier today at around $512. Here is a big warning signal. Shooting star reversal right at major resistance of $515 and it is backed up by volume spike today. I won’t be surprised to see this thing coming back down to about $490ish level or even lower.
8.20.13 Tuesday
Shooting Star + Engulfing Pattern
Bearish.
$490
if broken..
$470
8.22.13 Thursday
All Call Positions Closed @ $499.00
(Chart screened mid-day)
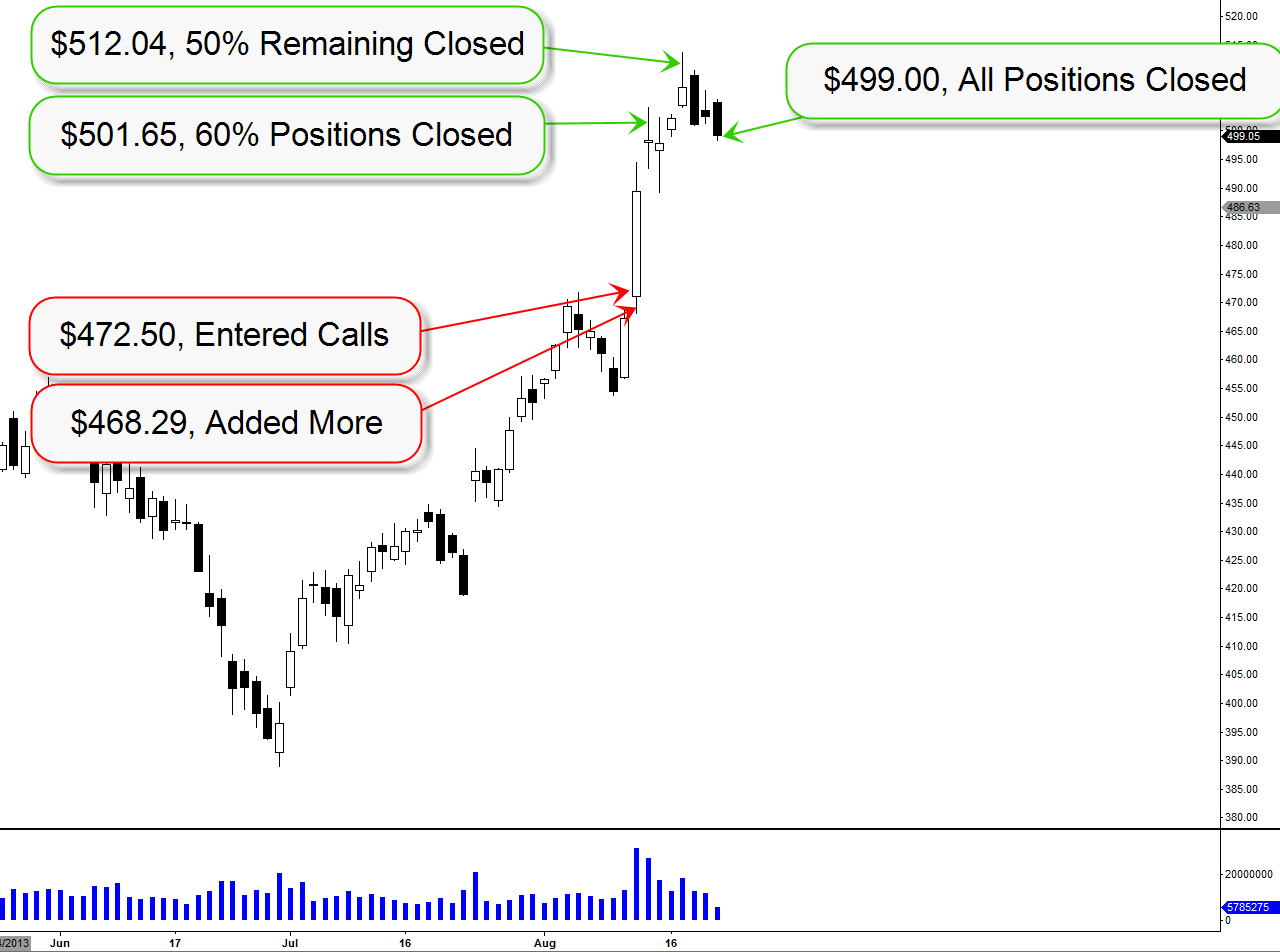
Looking at the end of the day chart, it is starting to look more like some kind of bullish continuation pattern such as bull pennant. Instead of having lower day after the bearish engulfing on 8/20, it held up last two days and that definitely helps. I am currently all of out of call position and personally I think the bigger pull back would be healthier rather than this continuation pattern as $515 seems to be looking pretty strong resistance which that coinciding with weekly 100SMA. But as of today, it does look good for more upside for short term.
How I Traded AAPL From $402 To $512 With Call Options