
Last Update: 8.01.13
Related Articles
09.28.12 “10 Reasons of Why I am Extremely Bearish on $AAPL“
12.15.12 “Why I Believe $AAPL is Headed $360“
07.24.13 “$AAPL My Long Trade (Part 3)”
07.27.13 “Looking at $SPY $AAPL [VIDEO]”
6.29.13 Saturday
1. Level 2 Hold
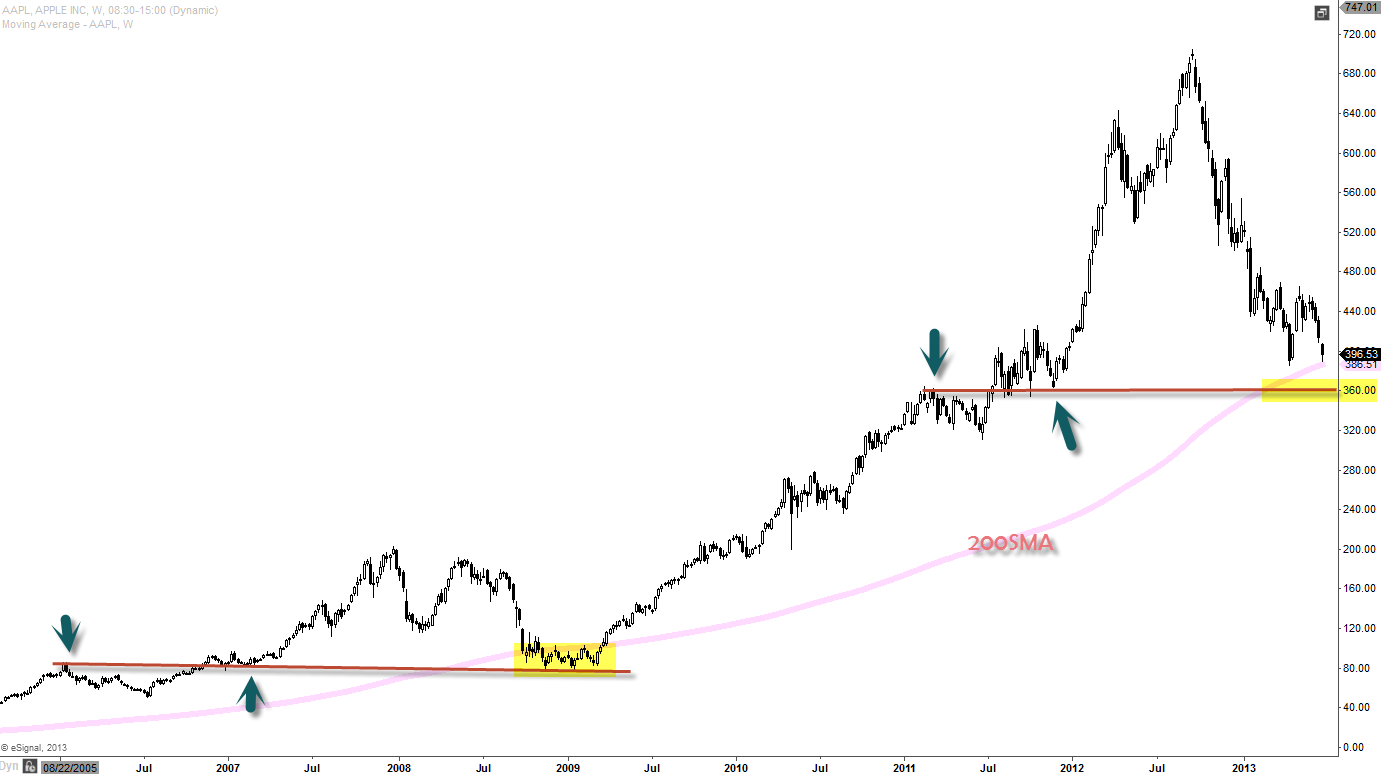
Weekly Chart with 200SMA
If $AAPL is bottoming, we must find support in the vicinity of $400-$360 because that’s where 200SMA is hanging out. As you can notably see that 200SMA acted as great support (200SMA being a long term moving average, it’s perfectly find to trade around that radiation level before finding support) back in 2009 and this is the level buyers must hold before seeing some healing process.
Currently $AAPL is trading just shy of $400 and it might even come down to about $360 (if we break below $390 support) where the pivotal support lies. Just like back in 2009, the pivotal level and 200SMA seems like the duo team that was able to push this back and start a new trend. Can this duo team of pivotal support of $360 and 200SMA do it again? Question still remains unanswered but looking at this chart alone you can see that how important $360 level is going to be reflecting where it found support back in 2009 crash.
2. Channel For Healing Process
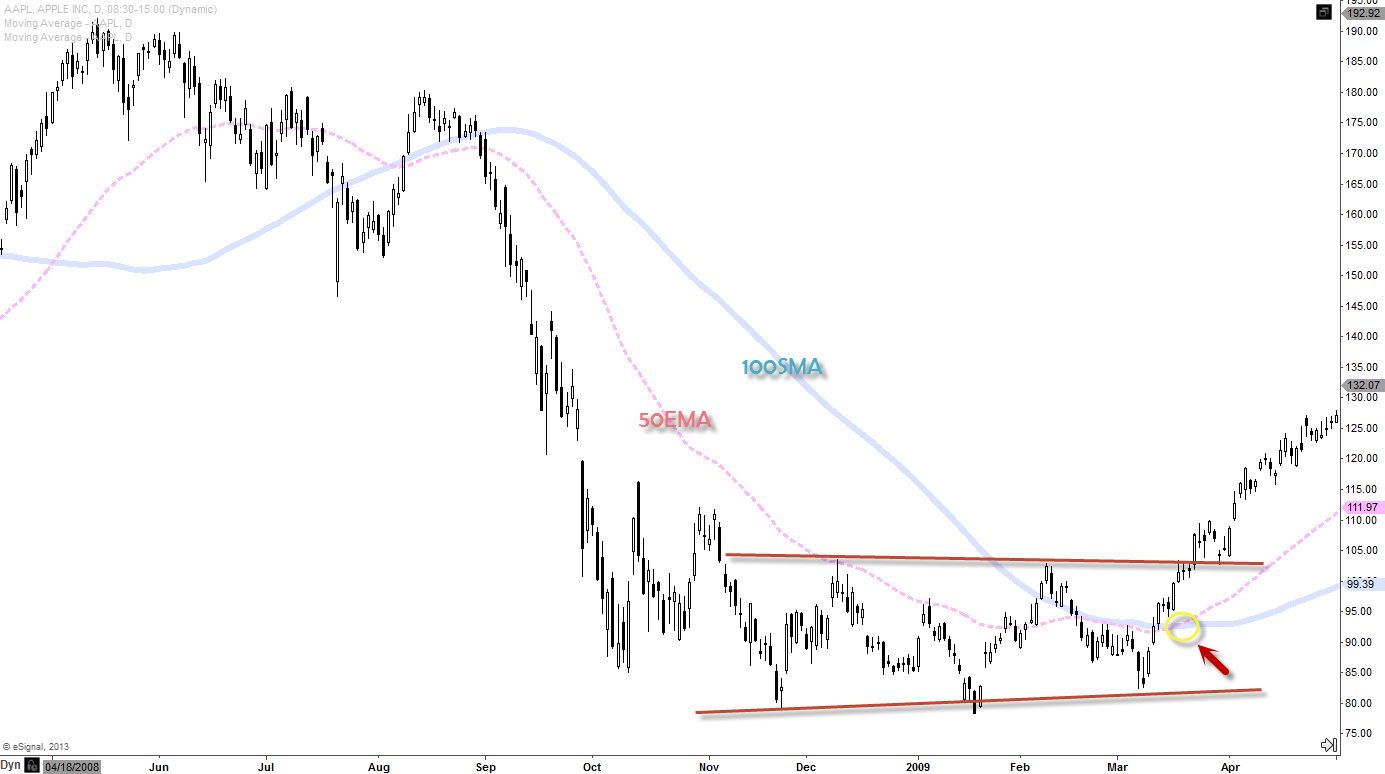
2009 Mid March Daily Chart
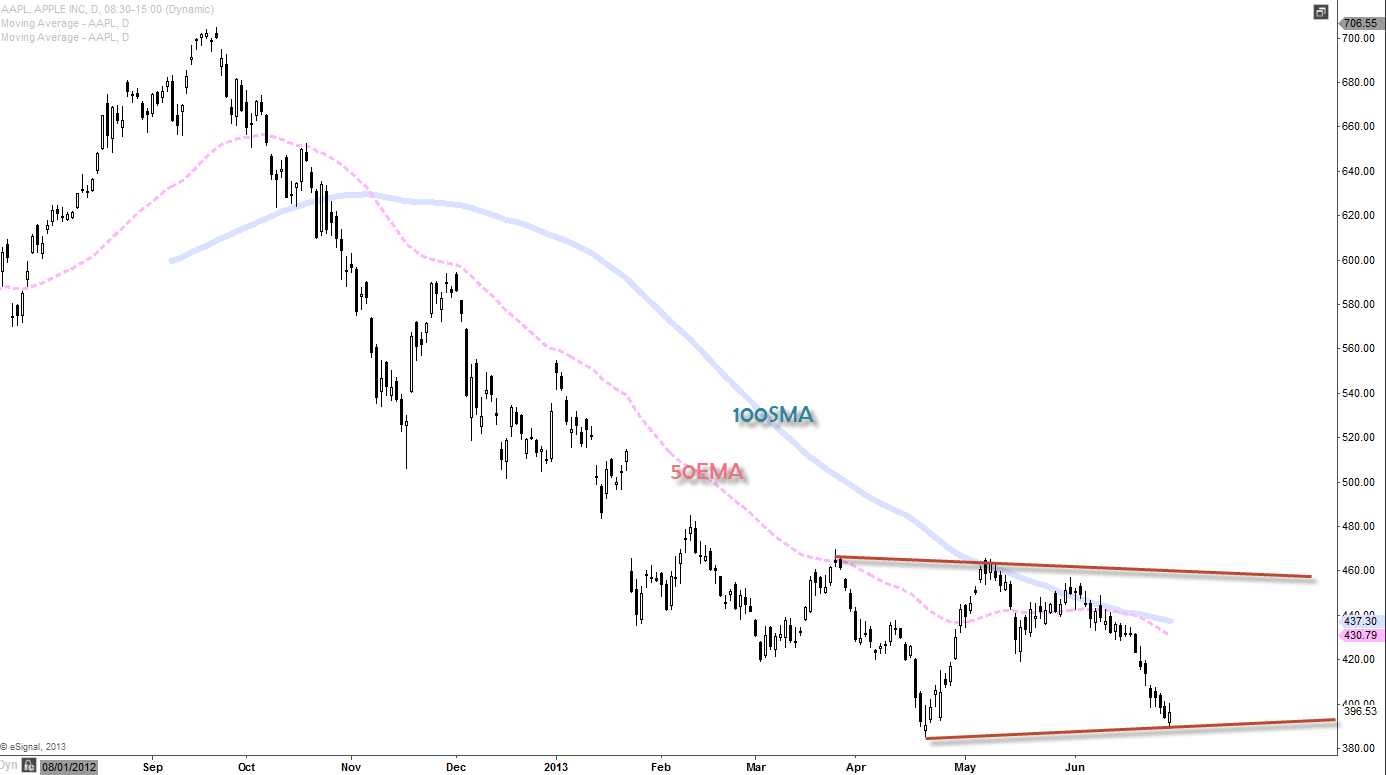
2013 Late June Daily Chart
After a crash from $700 and much speculated inverted H&S reversal failure recently, $AALP doesn’t have much option here but to form some kind of channeling action for the healing process to begin. I do not think it’s going to $600-$700 level straight up without some kind of base forming here. First sign to observe before finding some solid upwards momentum would be that 50EMA crossing 100SMA to the upside (golden cross) like it did back in 2009. After that obviously, it would need to close above recent resistance which is above $460ish level. If we can get those two squared away, we could have high probability that $AAPL can come out of this mess and thrive again.
3. Bottoming Indications
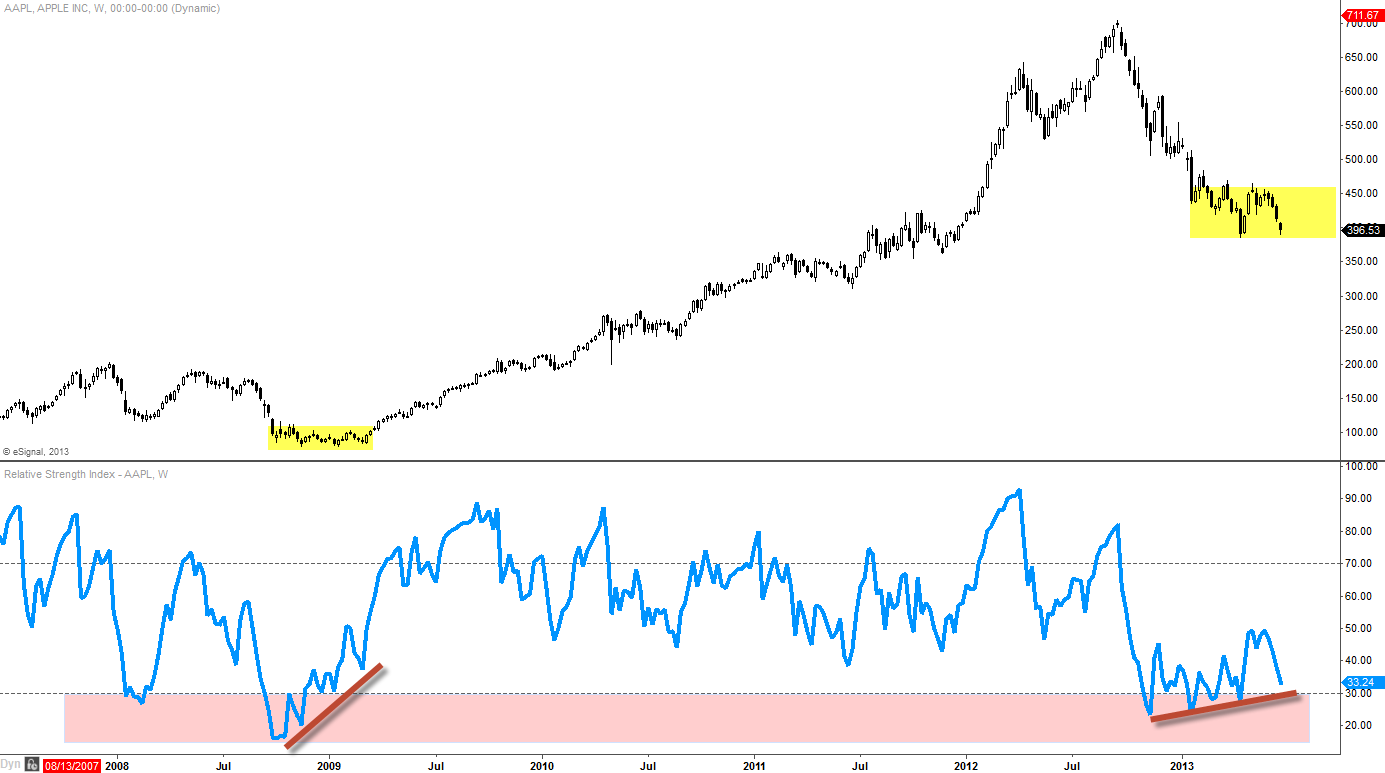
Weekly RSI
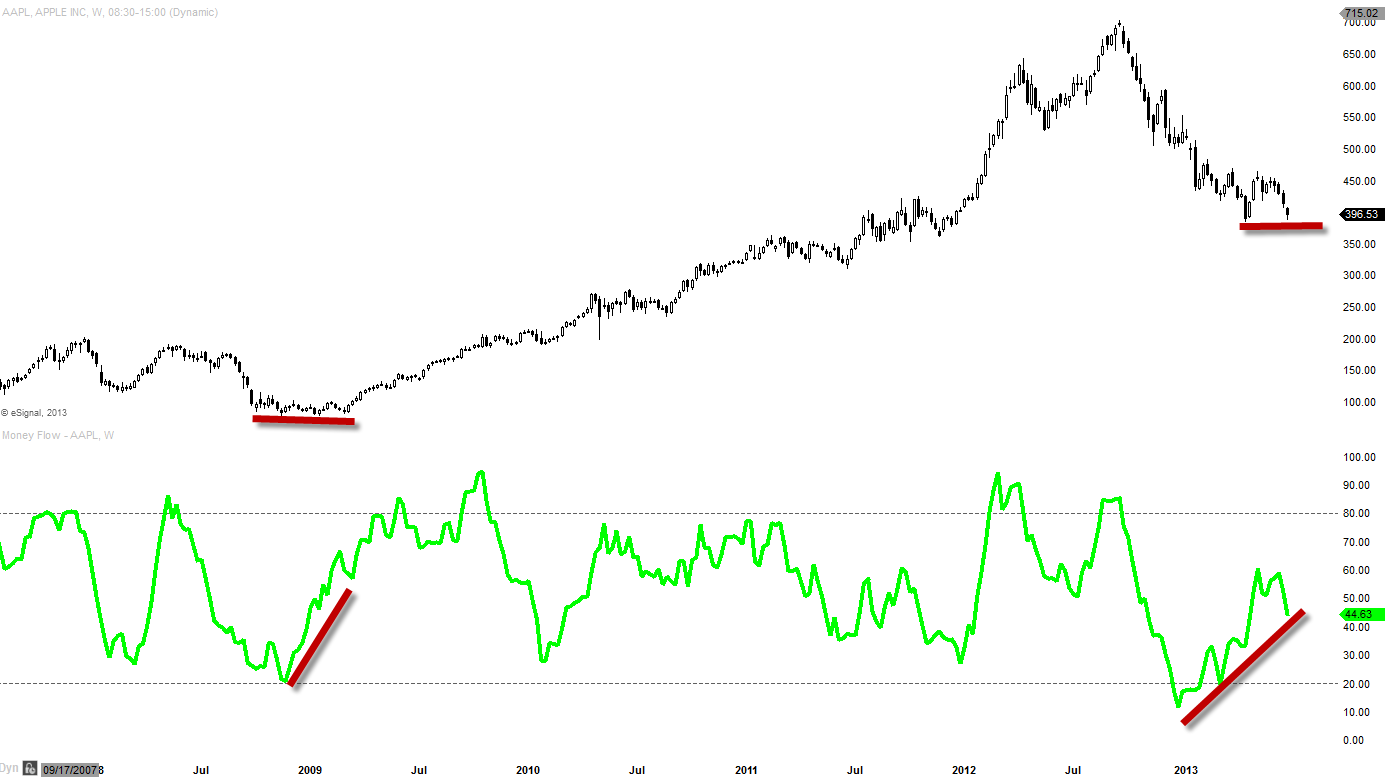
Weekly MFI
Obviously these indicator will and can come right back down to the bottom of the band if stock continues to fall. But if we can find some support in this vicinity and either move sideways for a bit before continue to the upside, these signs can be interpret as early sign of possible reversal.
As you can see RSI has been making higher lows and same with MFI and many times these are the early signal of accumulation before inauguration of a new trend. For this being weekly chart though the outcome might not be imminent but definitely the signal to keep an eye on to see if these indicators continue to move higher.
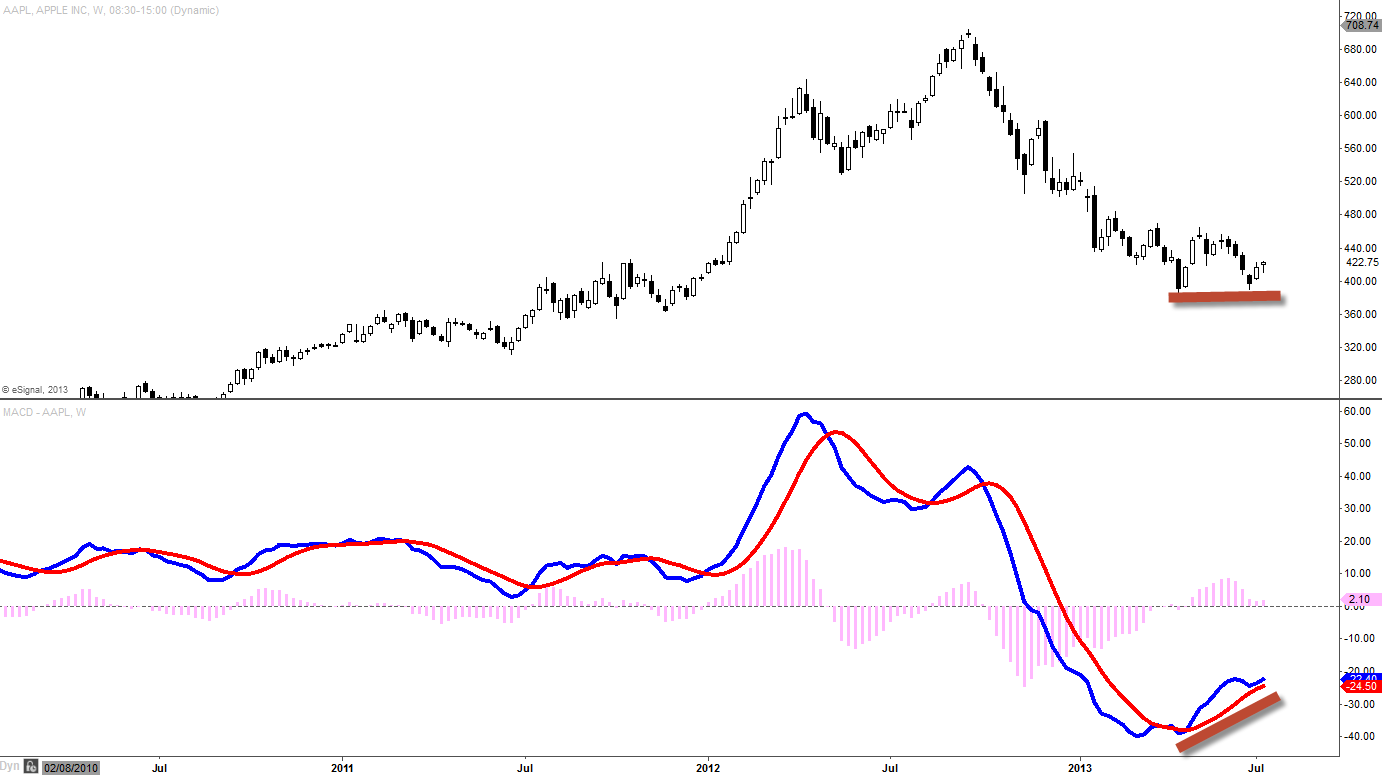
Weekly MACD
It’s not perfect formation of bullish divergence but we can definitely see a sentiment through this chart here. As $AAPL (weekly chart) finds support twice making flat lows, MACD is making higher lows (in a sense) which can be interpret is as bullish divergence. Many times this is an early indication for the reversal and perhaps we need confirmation to conclude that fact but still it’s a positive sign.
7.29.13 Monday
19 Months Later, They are UNITED
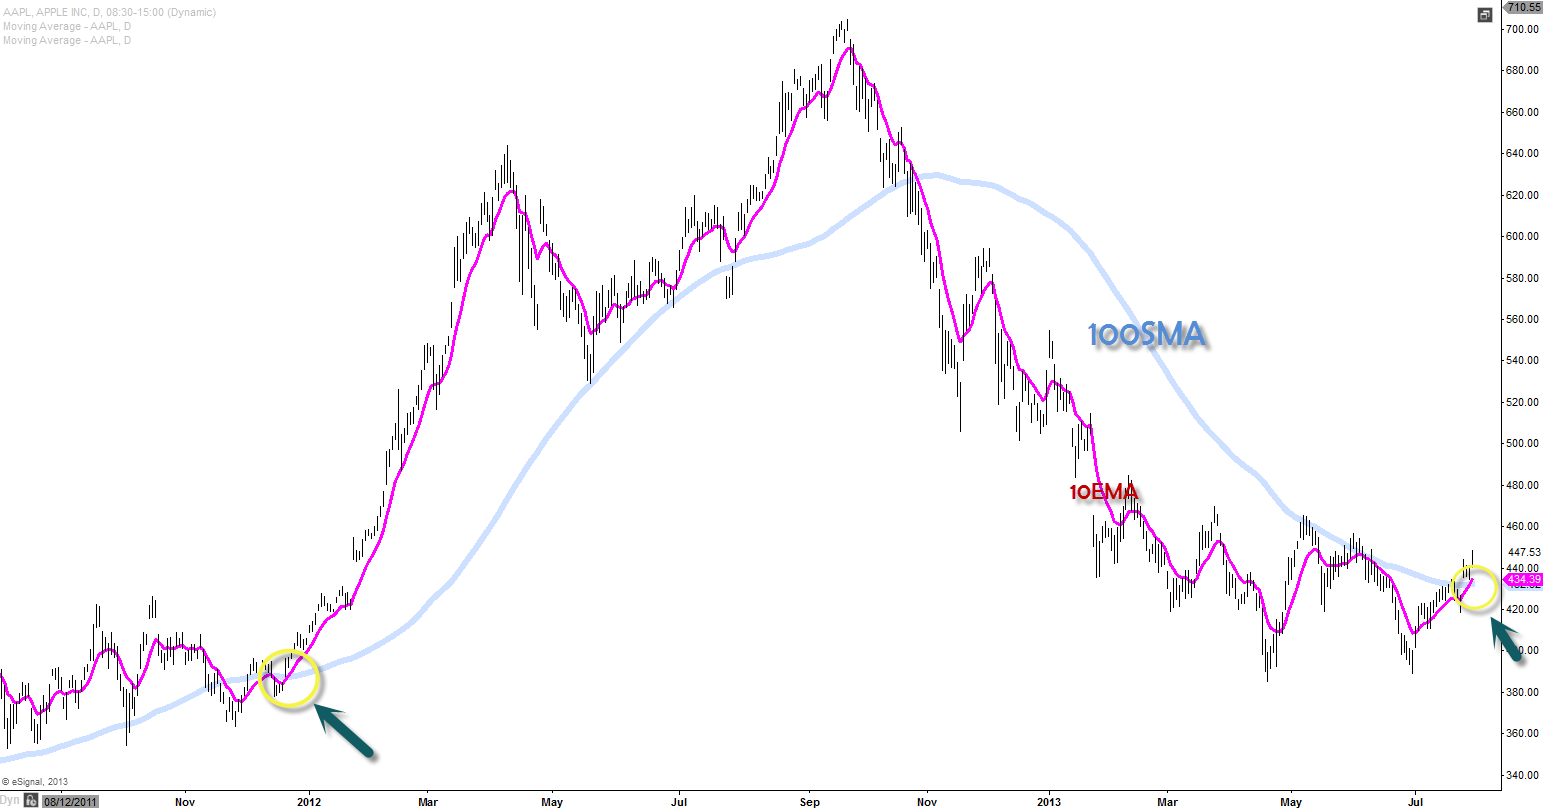
This is the first time 10EMA and 100SMA is crossing to the upside since about 19 months ago. That’s almost two years since they spent time together (to the upside)! This is extraordinary situation given the fact that after all these time, they are finally united again. This means the trend is slowly changing and $AAPL is slowing coming out of the slump. It’s still early stage but I believe $AAPL is coming out and in the works of creating new primary bullish trend.
Weekly 20EMA
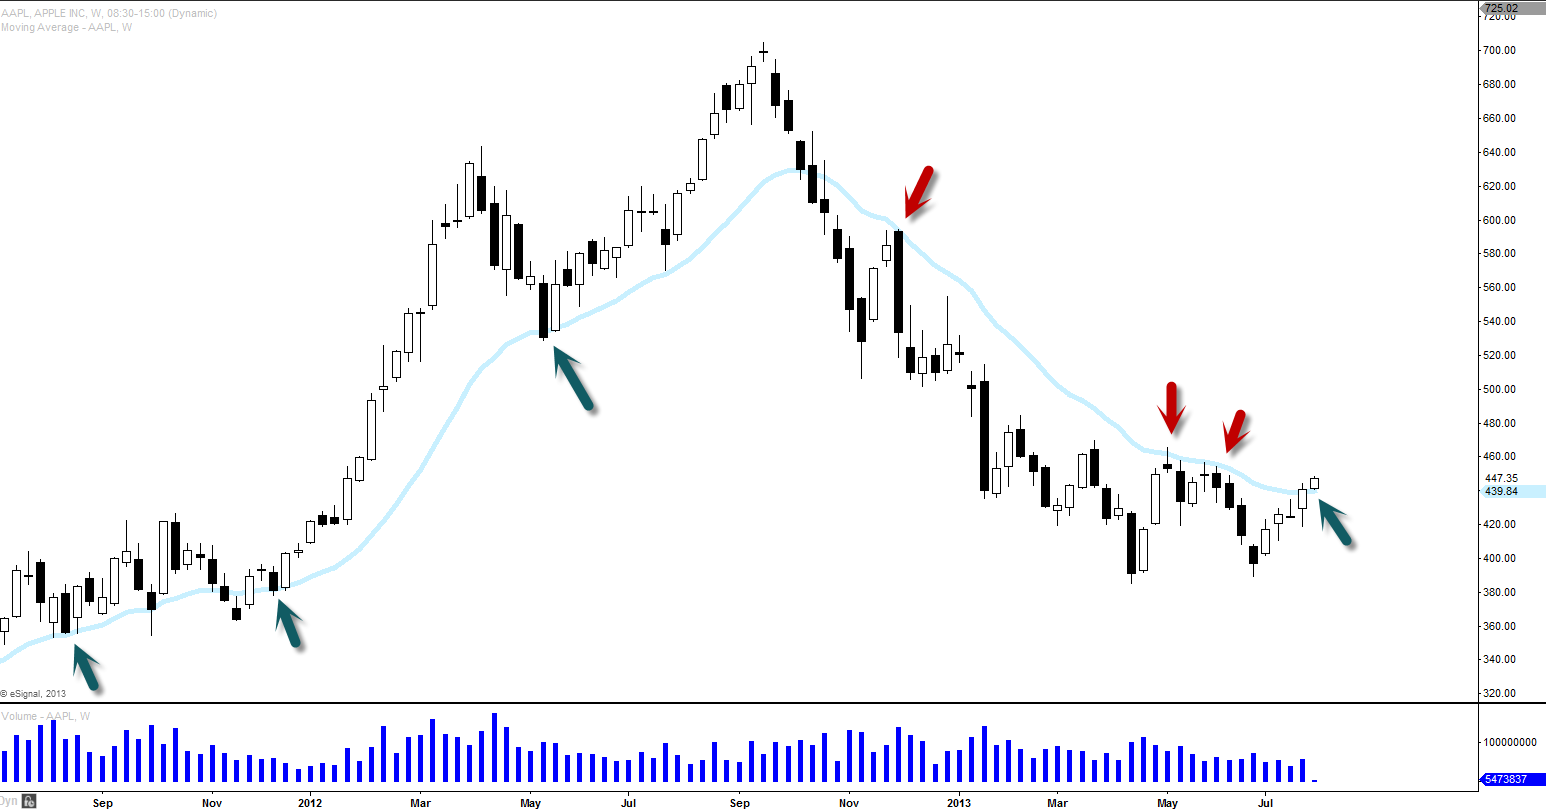
I know that the week has just started so this weekly chart with 20EMA might have no meaning (not just yet at least) as of today but as you can see we are starting to trade above weekly 20EMA. $AAPL was not able to close above 20EMA on this weekly chart ever since the crash. So I will be paying very close attention on Friday after the close to see if $AAPL was able to close above this weekly 20EMA. If we do close above 20EMA, I’d have to say that the momentum is shifting to the upside and the bullish strength is accumulating.
8.1.13 Thursday
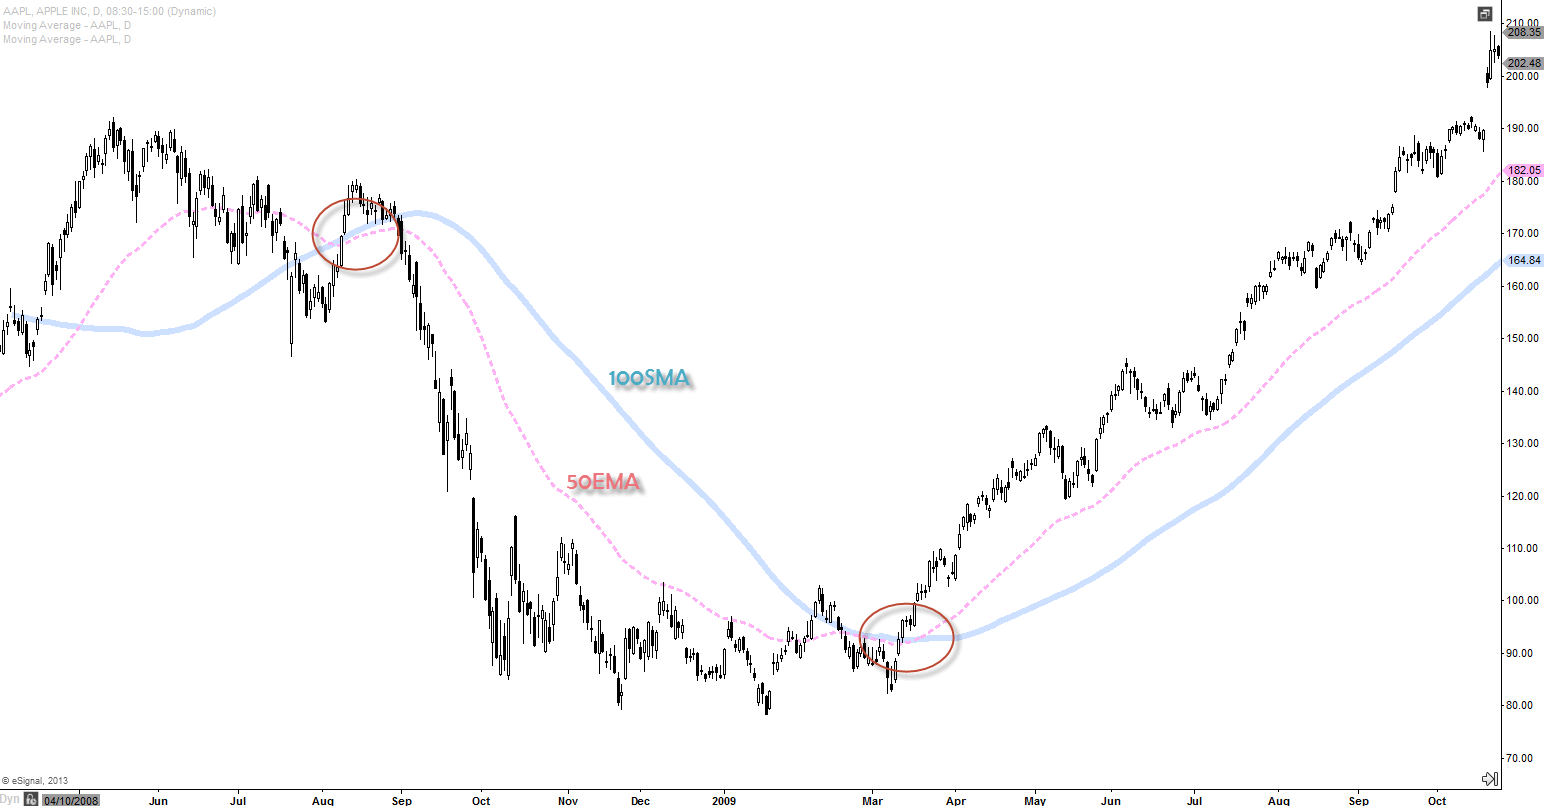
2009 March: Crash Recovery
(Daily)
2013 Aug: Crash Recovery
(Daily)
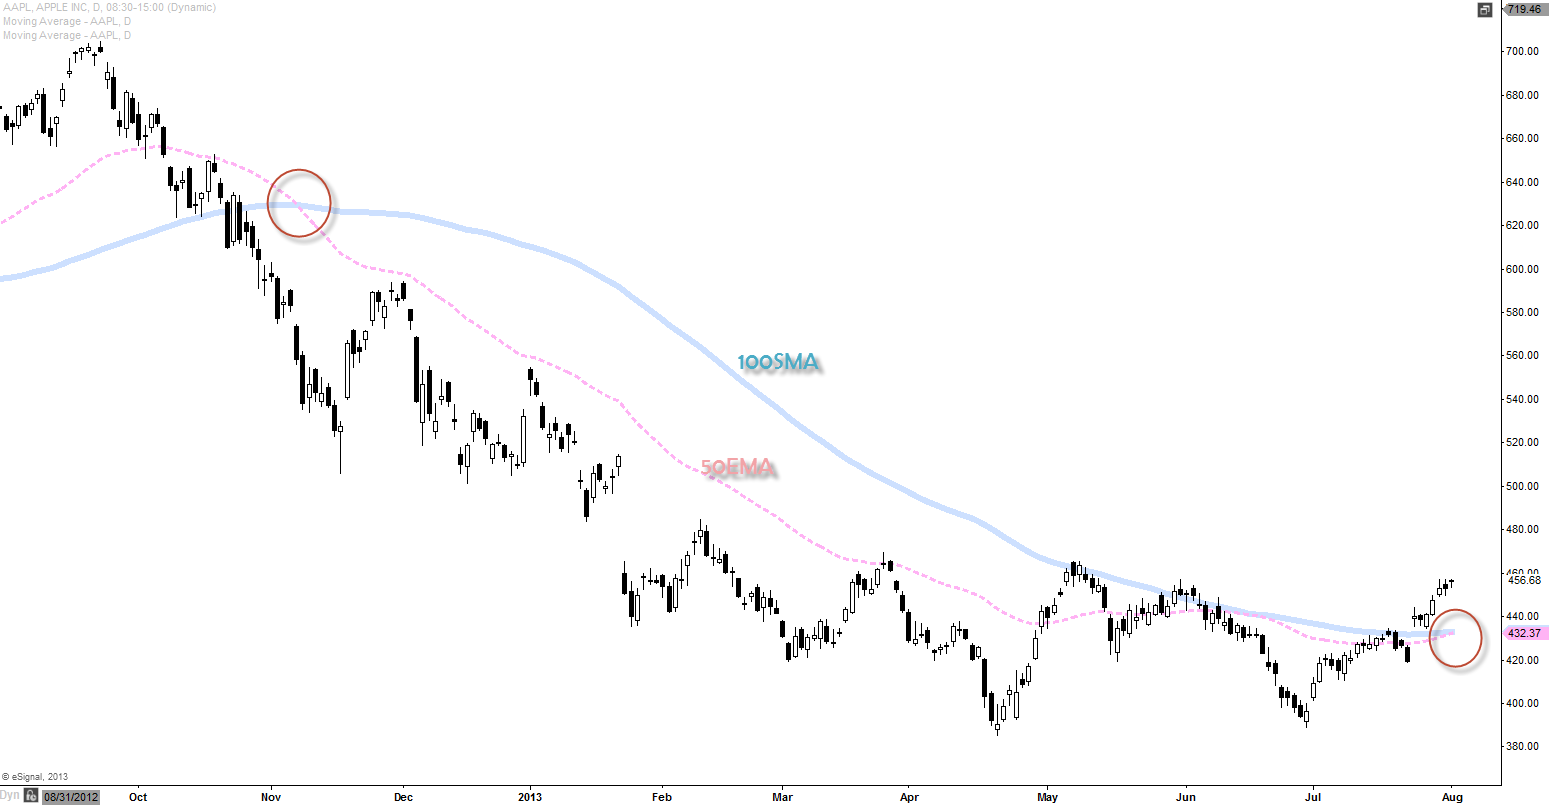
As you can see we are getting very close from 100SMA and 50EMA crossing to the upside. When $AAPL crashed back in 2008, this was the early indication of primary trend reversal. Can this be another early indication of this primary trend reversal and the recovery of this disaster? I think its possible if they can be crossed and continue to be separated and to do that we probably going to need $AAPL to close above $470ish level and hold there.