

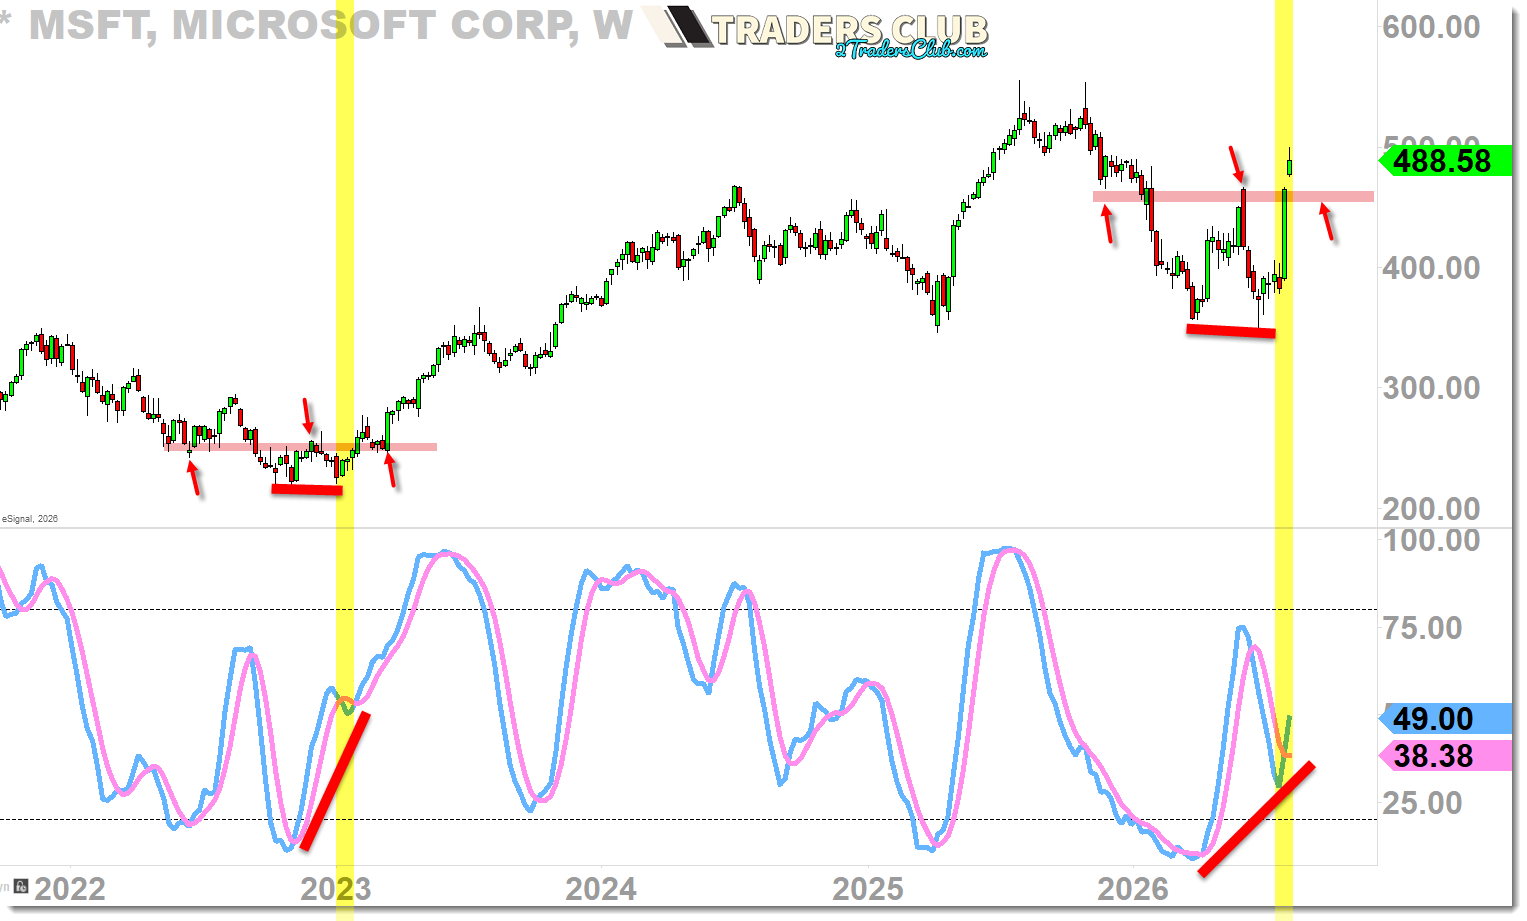
MSFT WEEKLY BARS:
- Last time we’ve had similar setup was back in early 2023 (see vertical highlights).
- The divergence is when the price creates either eqaual lows or lower low (see thick red line in price) while the oscillator creates higher low (see thick red line in the oscillator).
- This week, we’ve confirmed the weekly bullish divergence with the oscillator fully crossing up.
- And the price is breaking out above the resistance similar to 2023-setup (see red arrows in price).
- More often than not, when the price breaks out of the horizontal pivot (red box), it likes to come down and retest (see red arrows in price).
- There is an up-gap around 474-465, which could also act as support before the next leg higher.
- This RARE signal, when fully played out, it is a major reversal signal for the long-term uptrend until the oscillator hits the top of its band.