
It was dumb.
But I kept hearing about it and the more people talked about it the more bullish I got.
What was I keep hearing about??
The “death cross” signal.
Basically, mofoz be putting two long-term moving averages and they observe the cross down. They will say, if it crosses down, the long-term trend is in jepordy and major bear market has begun preparing 50-60% crash in S&P 500.
Let me tell you something, you can’t use one technical data to come to a major conclusion like that!
THIS ISN’T A PLUG-&-PLAY deal! 😠
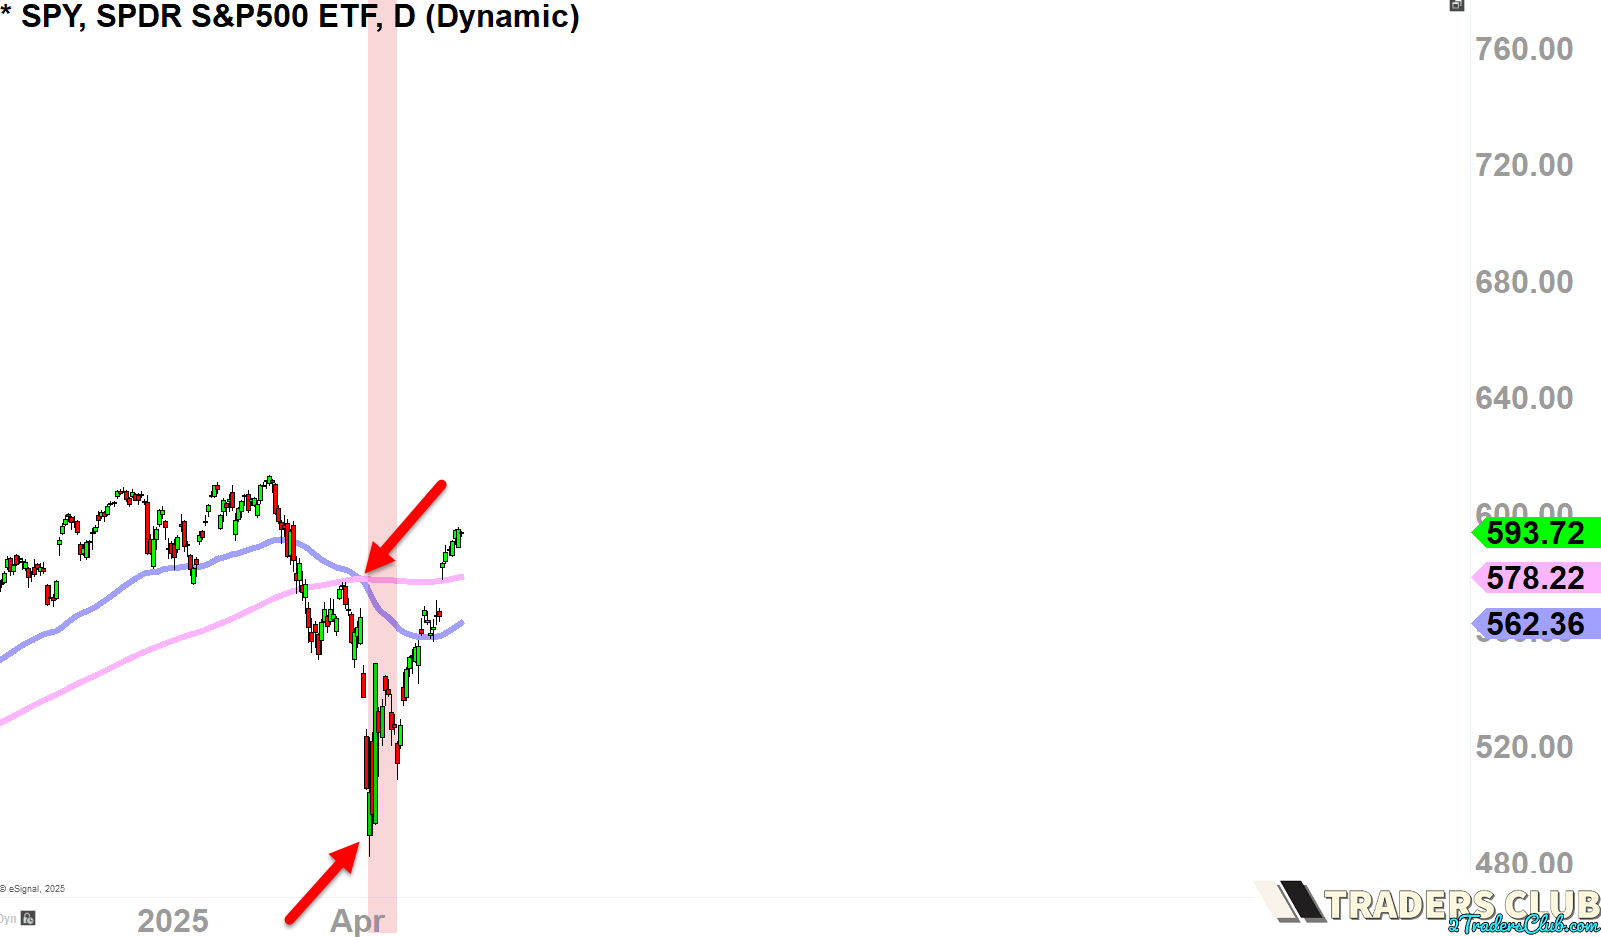
SPY DAILY BARS CHART
Check out the chart above and see for yourself what happened when the “death cross” occured (see red arrows).
IT MARKED THE PROVERBIAL LOW!
You have to understand that these long-term moving averages move very slowly (hence the “long-term”), so once you finally can make out the fact that it is fully crossing down (because there could be headfakes and what not), the market is already putting in the low.
This signal alone cost a lot of people everything panic selling near the lows; that’s a double loss because you have to account for the OPPORTUNITY COST that was lost as well.
These mofoz missed out another one of the greatest opportunities this market has ever produced.
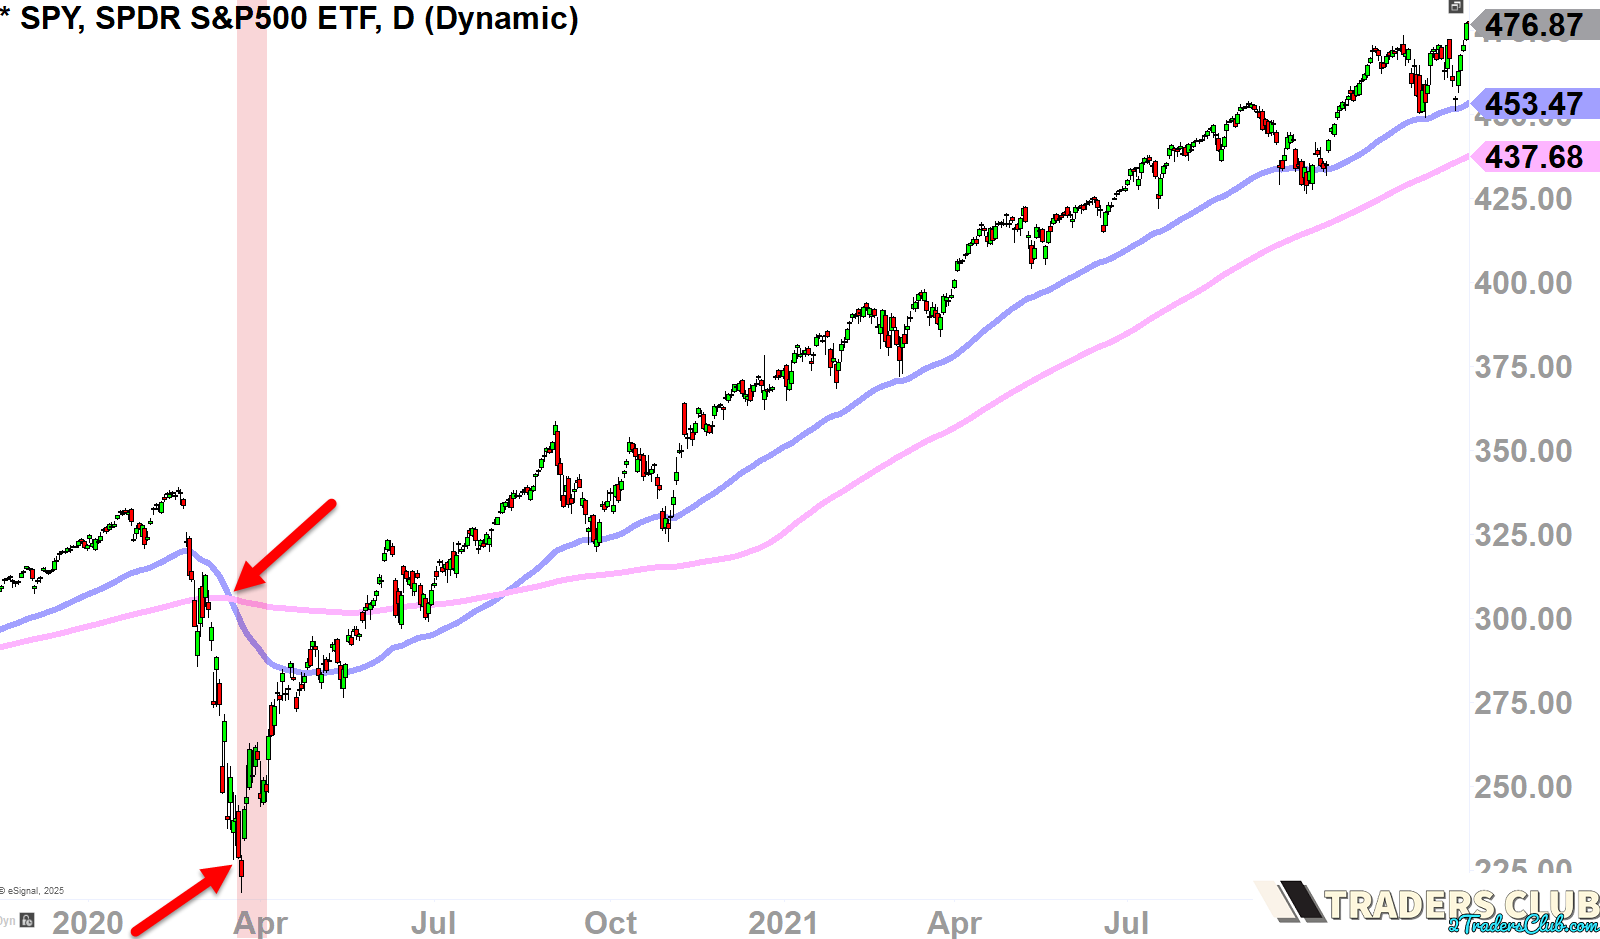
SPY DAILY BARS CHART 2020 -2021
Check out this chart above and see for yourself what happened during 2020 Covid.
Yes, the “death cross” signal marked the low and market, once again, fooled the majority!
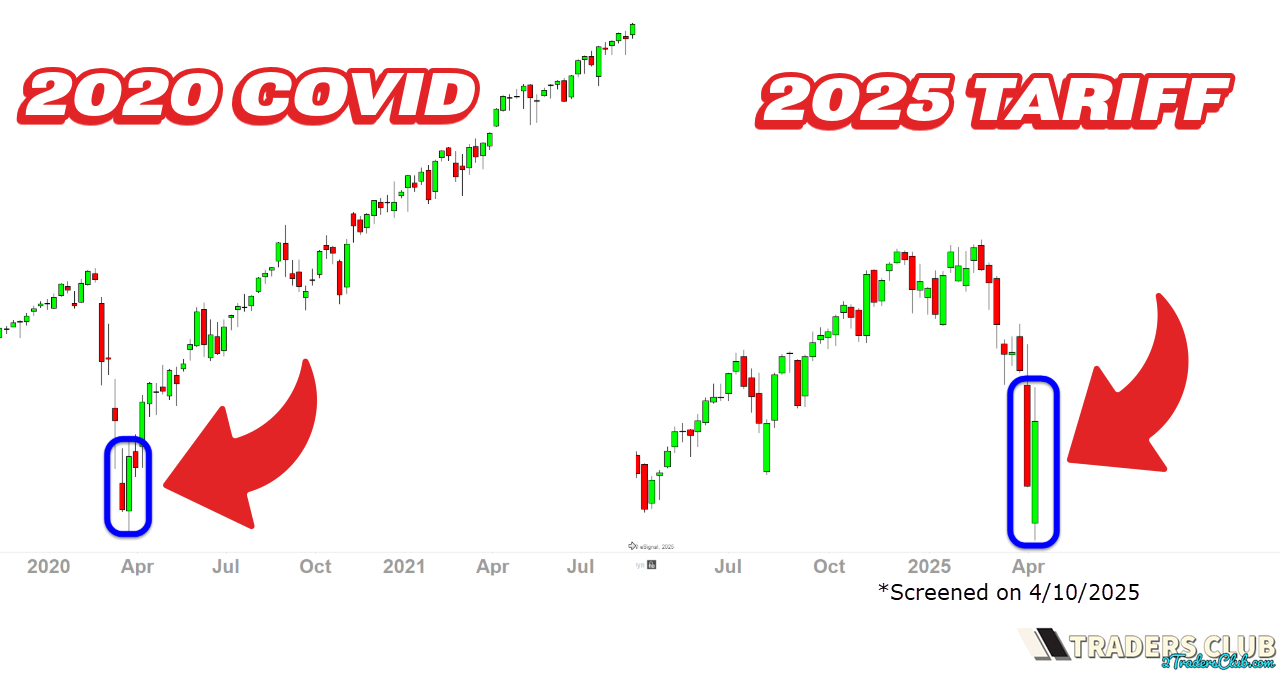
SPY 2020 “Covid” vs 2025 “Tariff” Weekly Bars
Well, I’ve been calling 2025 Tariff as “MINI COVID” because the overall sentiment was very similar—the way it came down and the way it reversed (I talked more about it in this video).
In this chart above (screened in early April), I was analyzing and forecasting how it could look similar to 2020 Covid reversal.
And, yes, it has; it’s been almost identical the way it has reversed as we are approaching the ATH level (only 3% away as of today)!
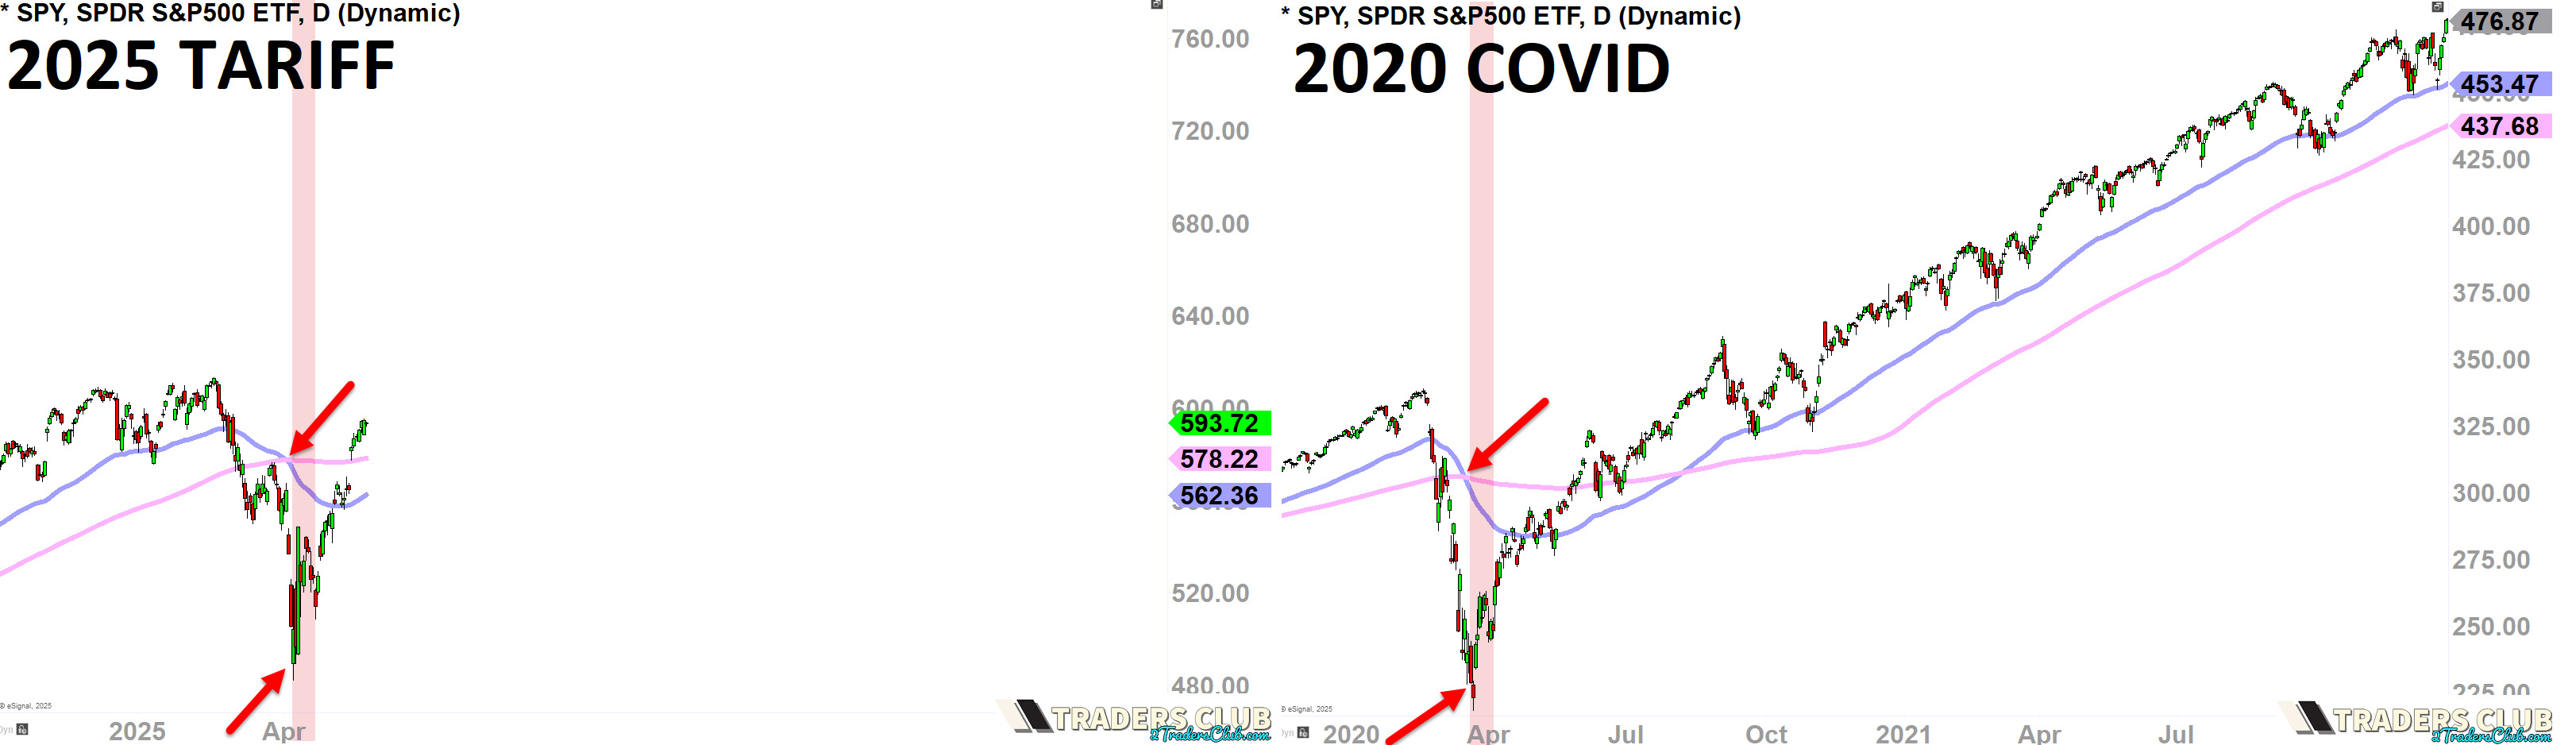
So then, maybe, the outcome of 2025-2026 might be similar to 2020-2021..? 👀


