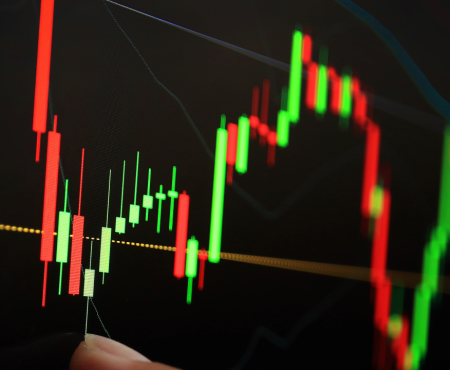
REVERSAL SIGNAL?
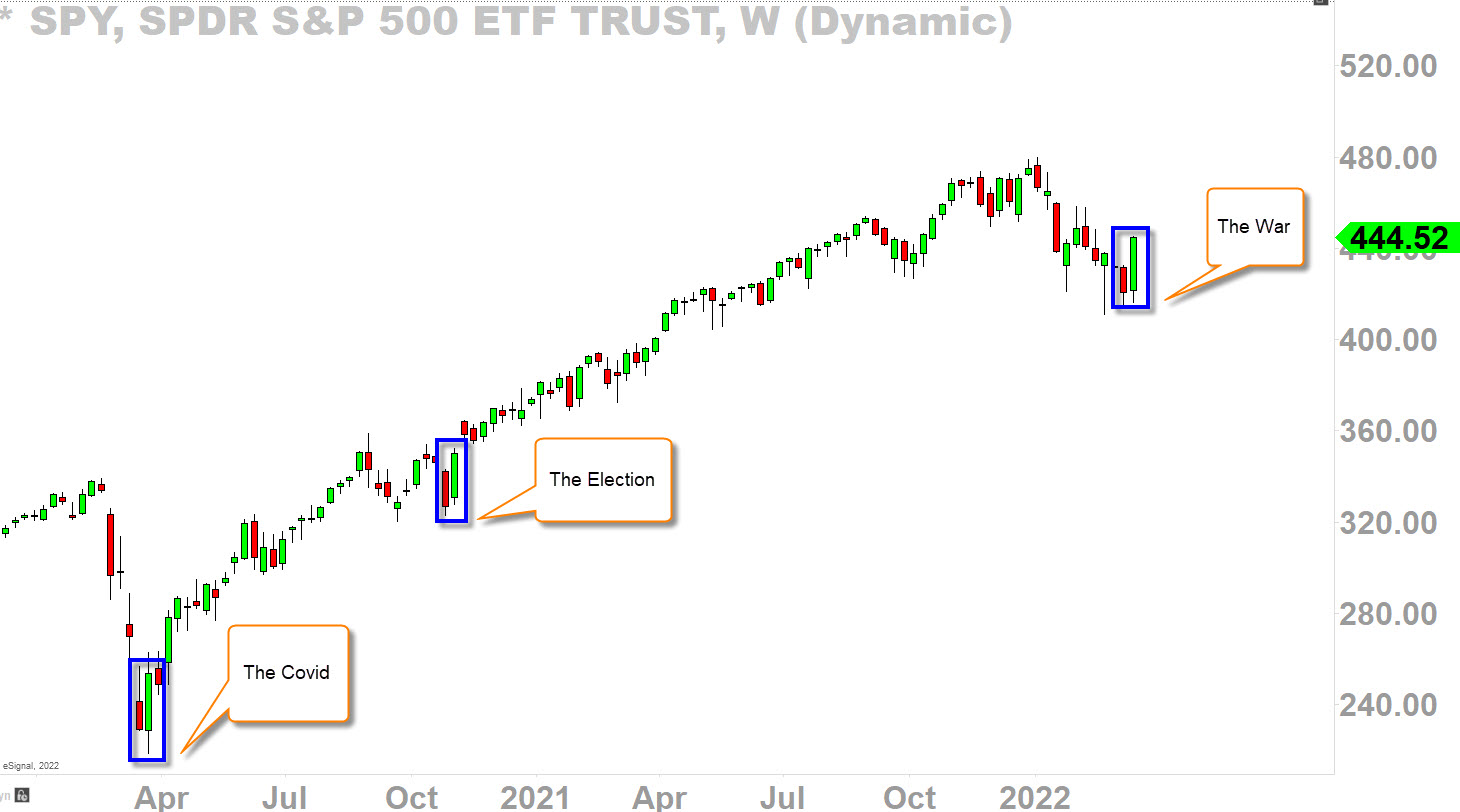
This is a weekly-chart, meaning, each candle represents one-week worth of trading data.
After a correctional phase in the market depicted as below: “The Covid, “The Election,” and “The War;” It seems to me that the market likes to reverse back up with the strong bullish candle as you see below (blue boxes) known as the ‘bullish engulfing’ candle (because it completely engulfs the previous week’s candle; to be technically precise/correct, November 2020 candle pattern is actually a ‘white soldier’ rather than a ‘engulfing’ but close enough).
As long as the price stays above this candle in the next few weeks, I think there is a good chance the market is ready to march higher and resume with it’s primary-term uptrend.
.
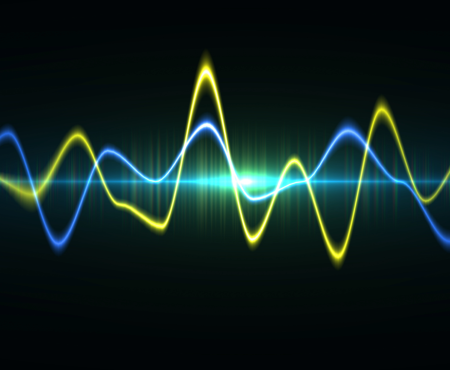
OVERSOLD SIGNAL?
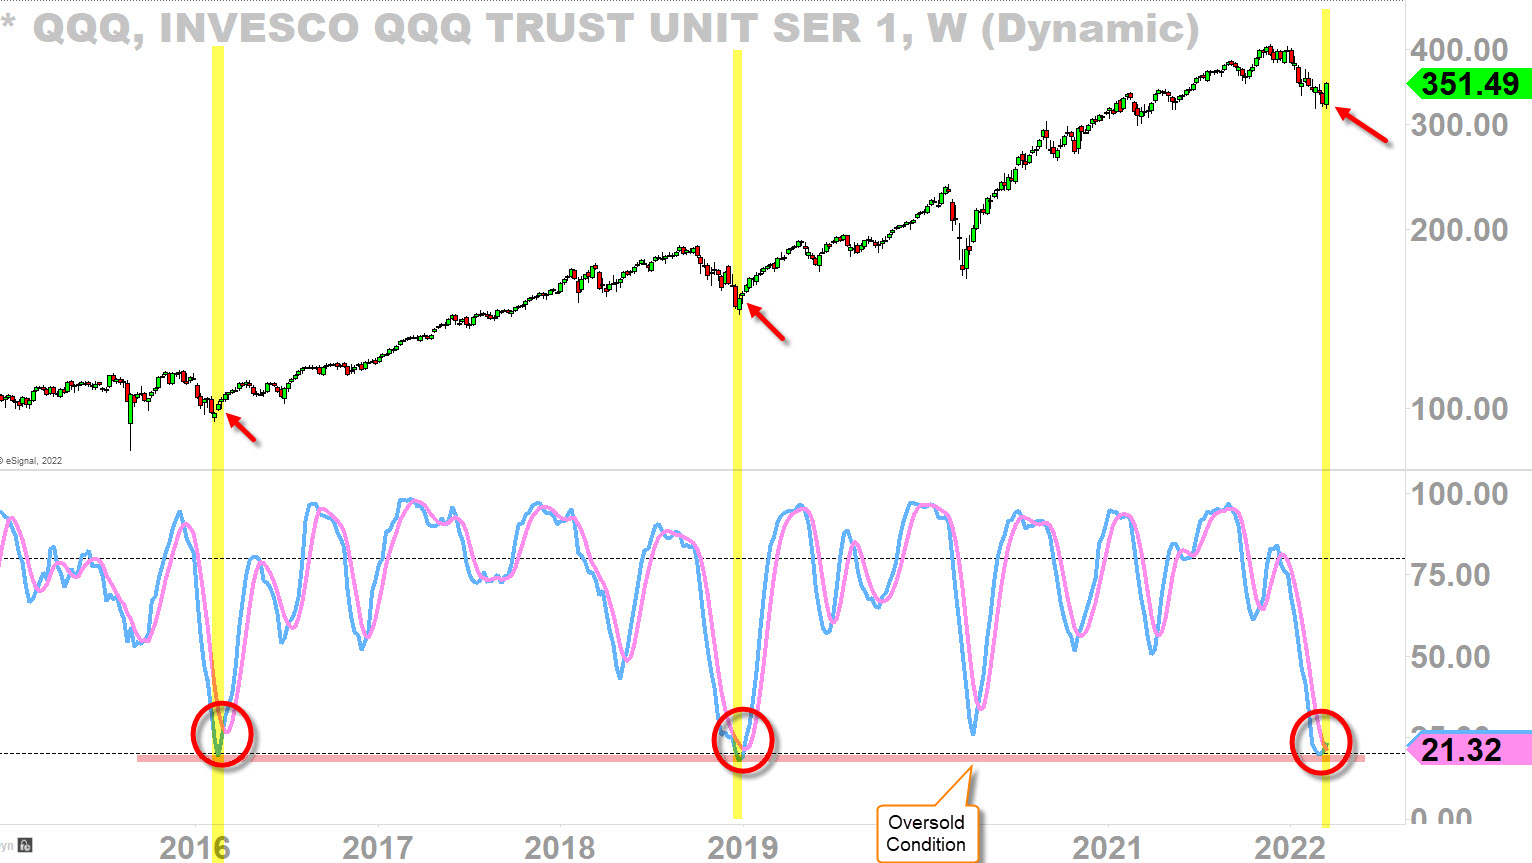
Let’s take this analysis one step higher looking at the NASDAQ (QQQ) weekly-chart but, this time, adding the oscillator into the mix.
Going all the way back to 2016, it looks like, every single time, when the oscillator hits the “oversold condition” and crosses back up (red circles), market tends to put in the bottom before the primary-term trend to resume to the upside.
Any signals can fail in the market so what I am looking for is the follow-through in the next few weeks to confirm the reversal.
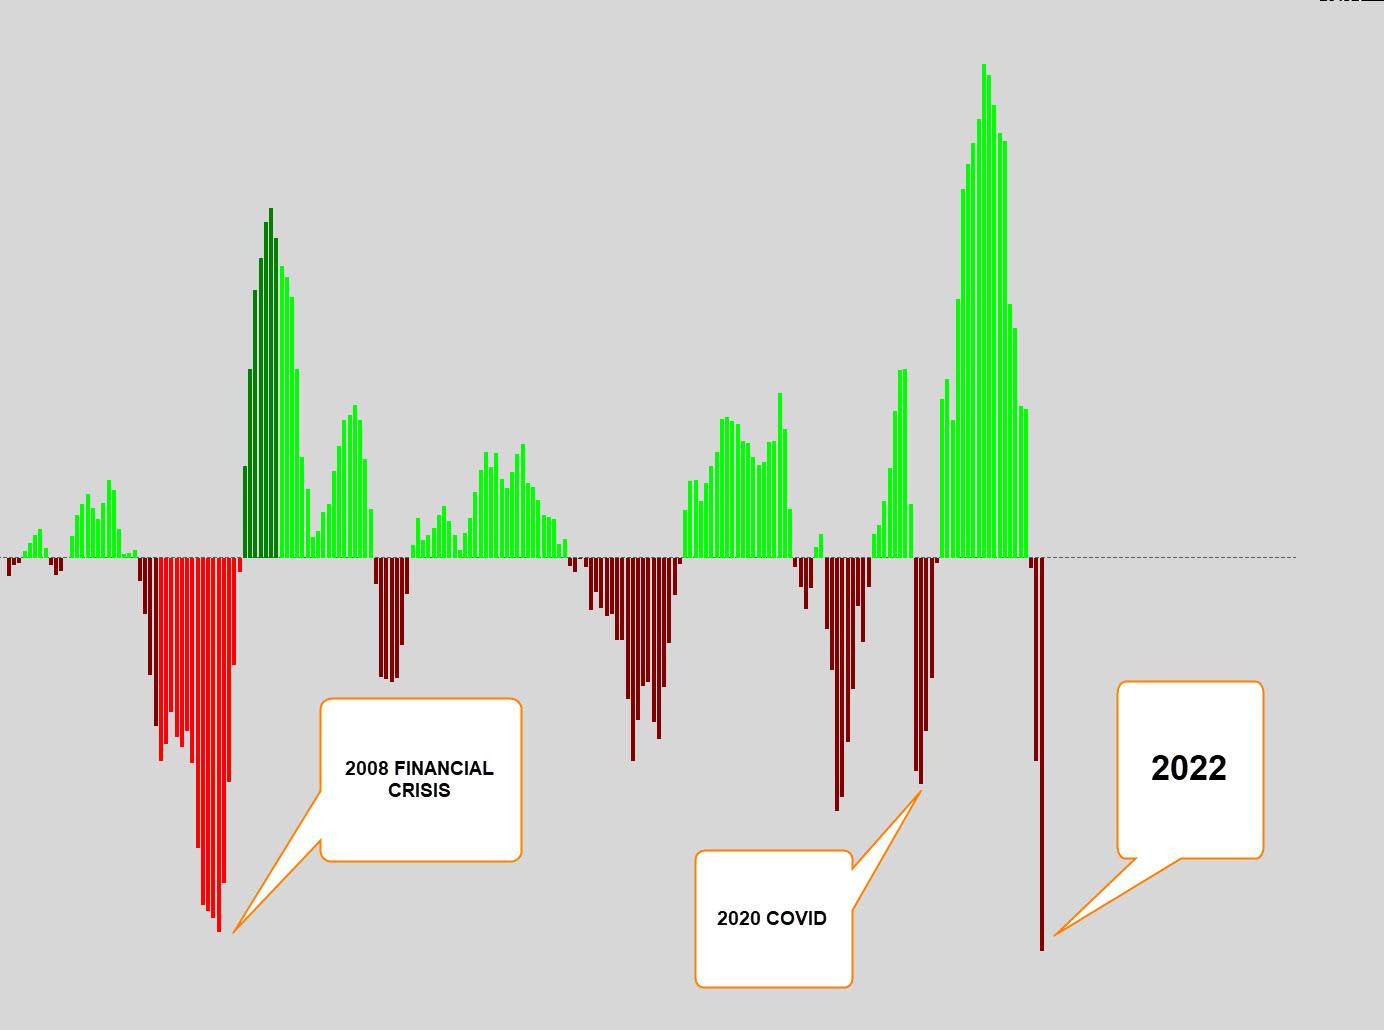
MORE FEAR TODAY THAN COVID?
Check this out.
This is my special indicator to gauge the fear/greed sentiment in the market, and it looks like people are more scared today than 2020 Covid! isn’t that crazy?
Well, that tells me, this might be another great buying opportunity especially for those who missed out 2020 Covid lows.
*Come trade with me here at Traders Club, and learn about what I am buying and what I’ve been buying recently–March promo this week
