

[divider]
Related Article
06.17.14 “My $TSLA Calls”
10.09.14 “$TSLA Warning Signal [Part 1]“
10.27.14 “$TSLA Warning Signal [Part 2]”
12.03.14 “[VIDEO] Mid-Week Update with Kay Kim” –covered $TSLA
[divider]
Weekly Bearish Divergence
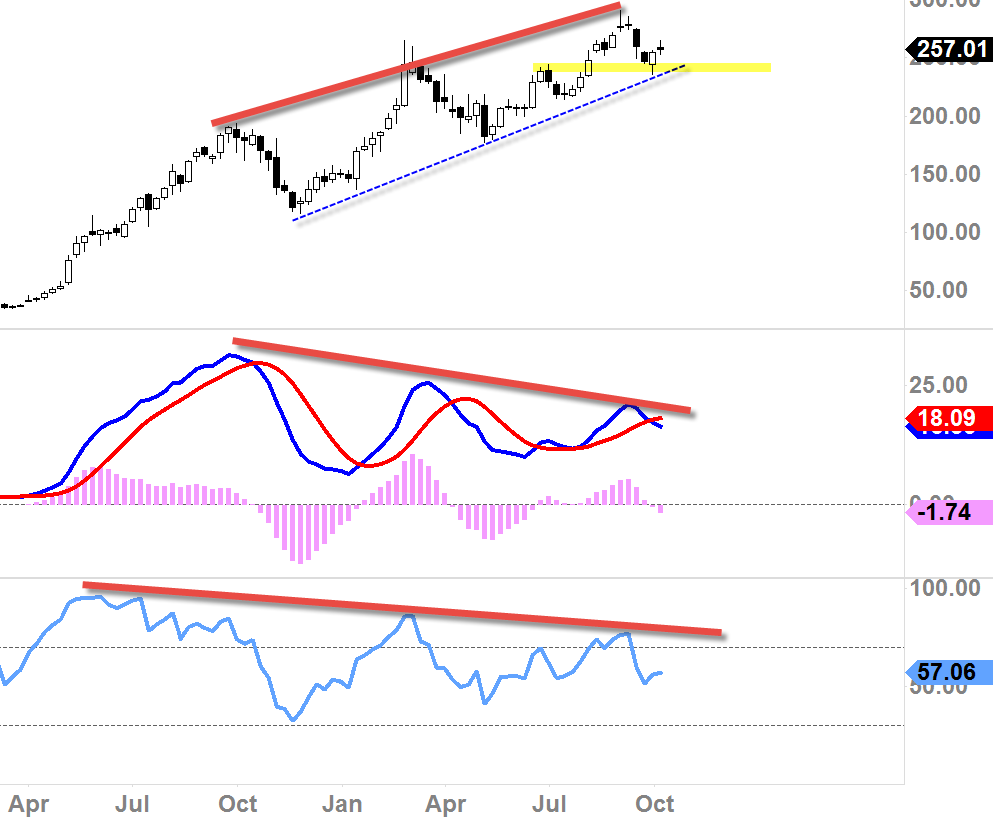
*Above chart (screened on 10/9/14) featured on the article 10/9/14
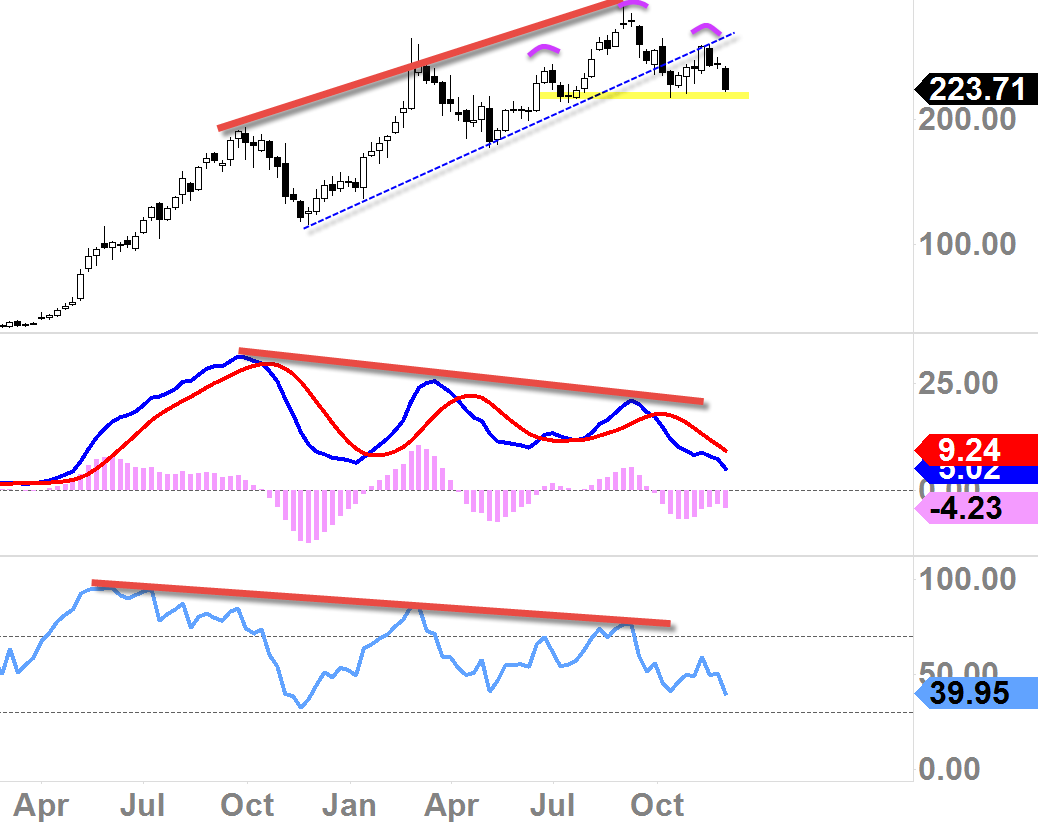
*Above chart screened today
Since the article back in October 9th, that MACD bearish divergence really progressed as you can see on the chart above (still sloping down). Indeed it has been very hectic for the buyers since the early October, and this signal was one of the biggest reasons of why we did not touch Tesla since our last trade.
The current problem is that the divergence is still active which means selling pressure is still there, and for this being a weekly chart, it’s going to take more than a several days of bullish run to change or to nullify this signal. As long as we have MACD continuing to slope down, the pressure is coming down from above, and things are going to be continued to be hectic in the intermediate to primary term.
While the overall market has been adamantly bullish, Tesla continued to show weakness last few weeks, this is not a good sign because when the fear steps forward in the overall market (market indices), I wonder how Tesla is going to react (obviously, it hasn’t been acting so well in the bullish environment we’ve been having).
Looking at the weekly price-action, we do have potential H&S formation, and it is not confirmed as of today, but when it does confirm, it’s going really add to the bearish sentiments we already have and it’s going to weigh it down much more.
[divider]
Monthly Bearish Divergence
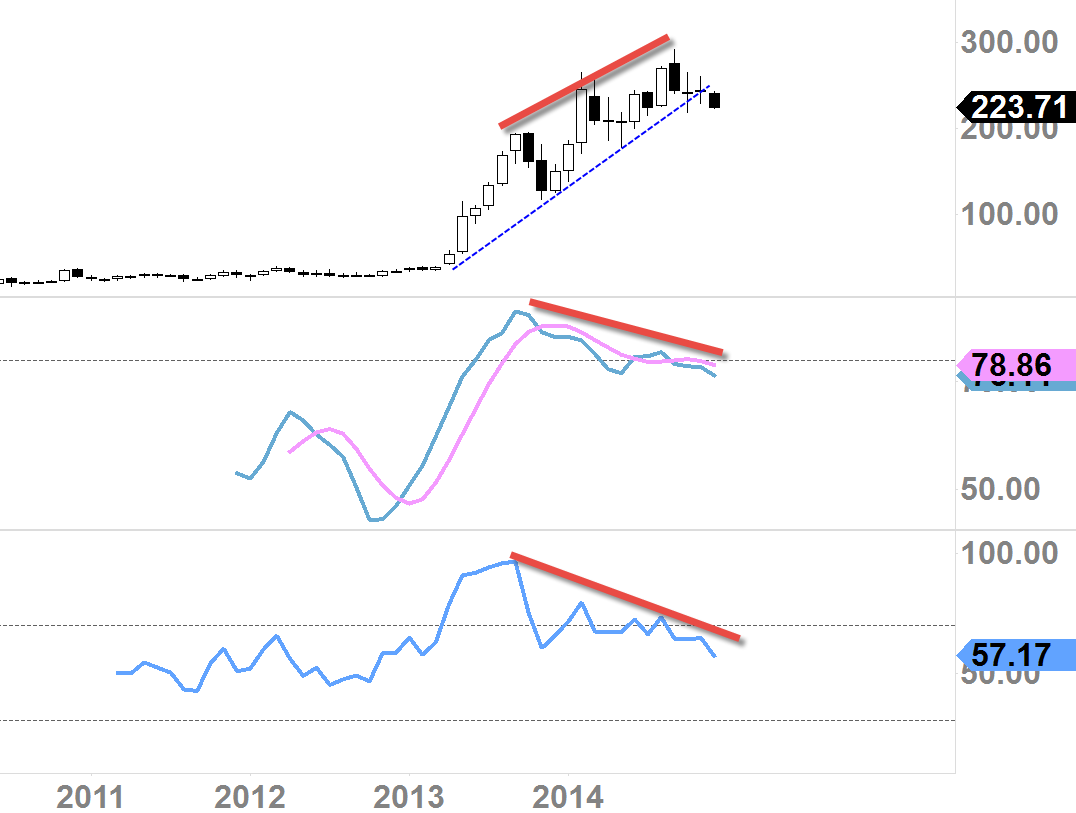
To make things worse, we have bearish divergence starting to confirm in the monthly term. This is probably the worst signal you would want to see if you are a Tesla fan-boy. This signal alone isn’t a huge deal, but when it forms along with weekly-term divergence, let’s just say now we are talking potential major-topping insinuations/signals.
[divider]
Daily Price-Action
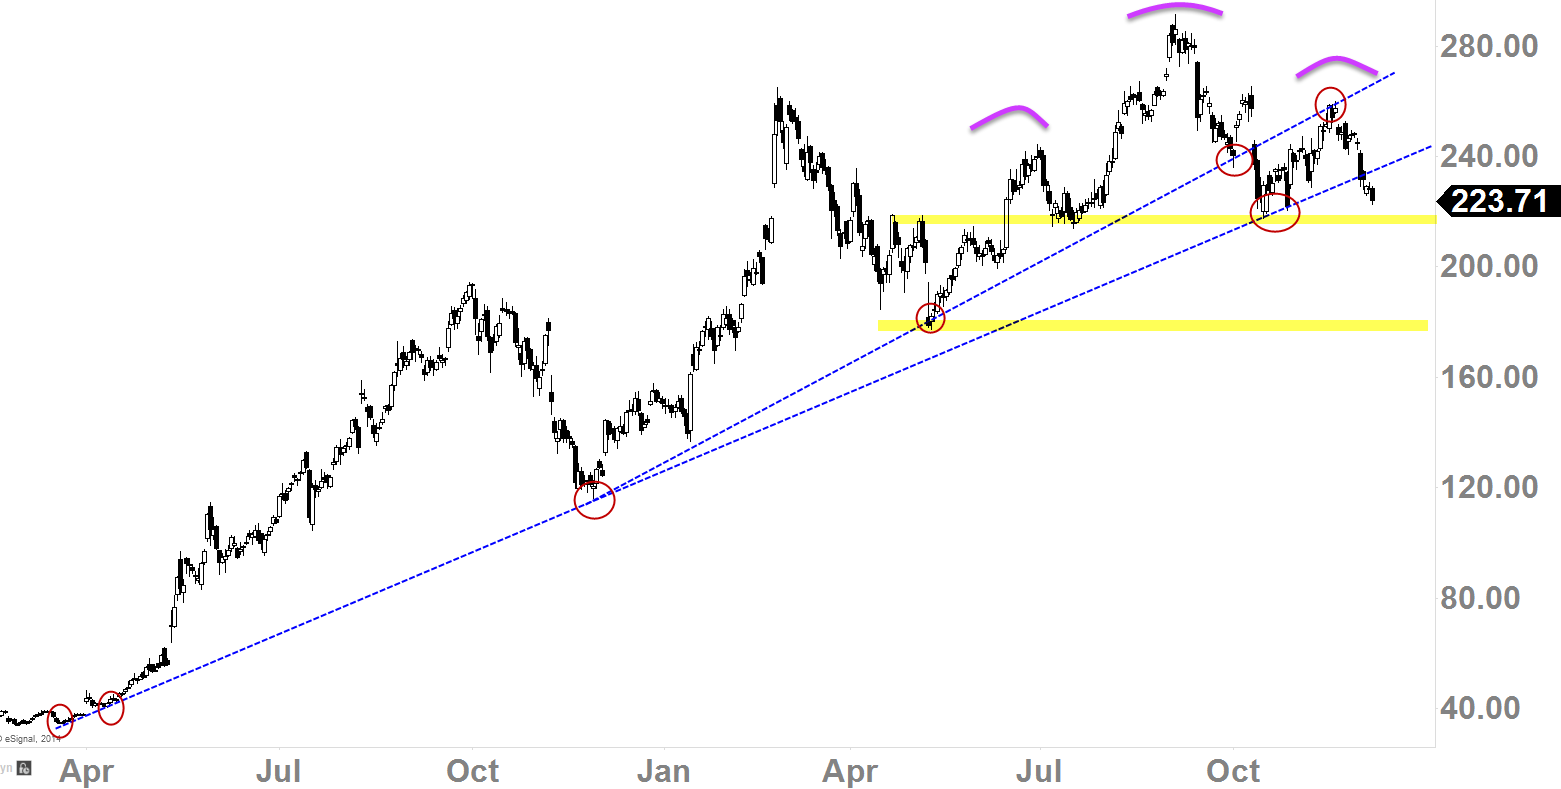
- Wide scale H&S formation (not confirmed yet)
- Uptrend supports (rising blue-dotted line) have been compromised
- $215 next must-hold level
- $177-$180 is the next level of support (if $215 is broken)
- If $215 is broken, that would be an initial confirmation of that massive H&S reversal pattern
[divider]
Let’s Recap
- Weekly Bearish Divergence
- Monthly Bearish Divergence
- Daily & Weekly H&S formation
- Uptrend supports have been compromised
- Continues to struggle in a bullish market
- $215ish is MUST-HOLD level
- If we break well below $215, H&S confirms
- $177-$180 is the next level of support if $215 broken