[divider]
Weekly Bearish Divergence
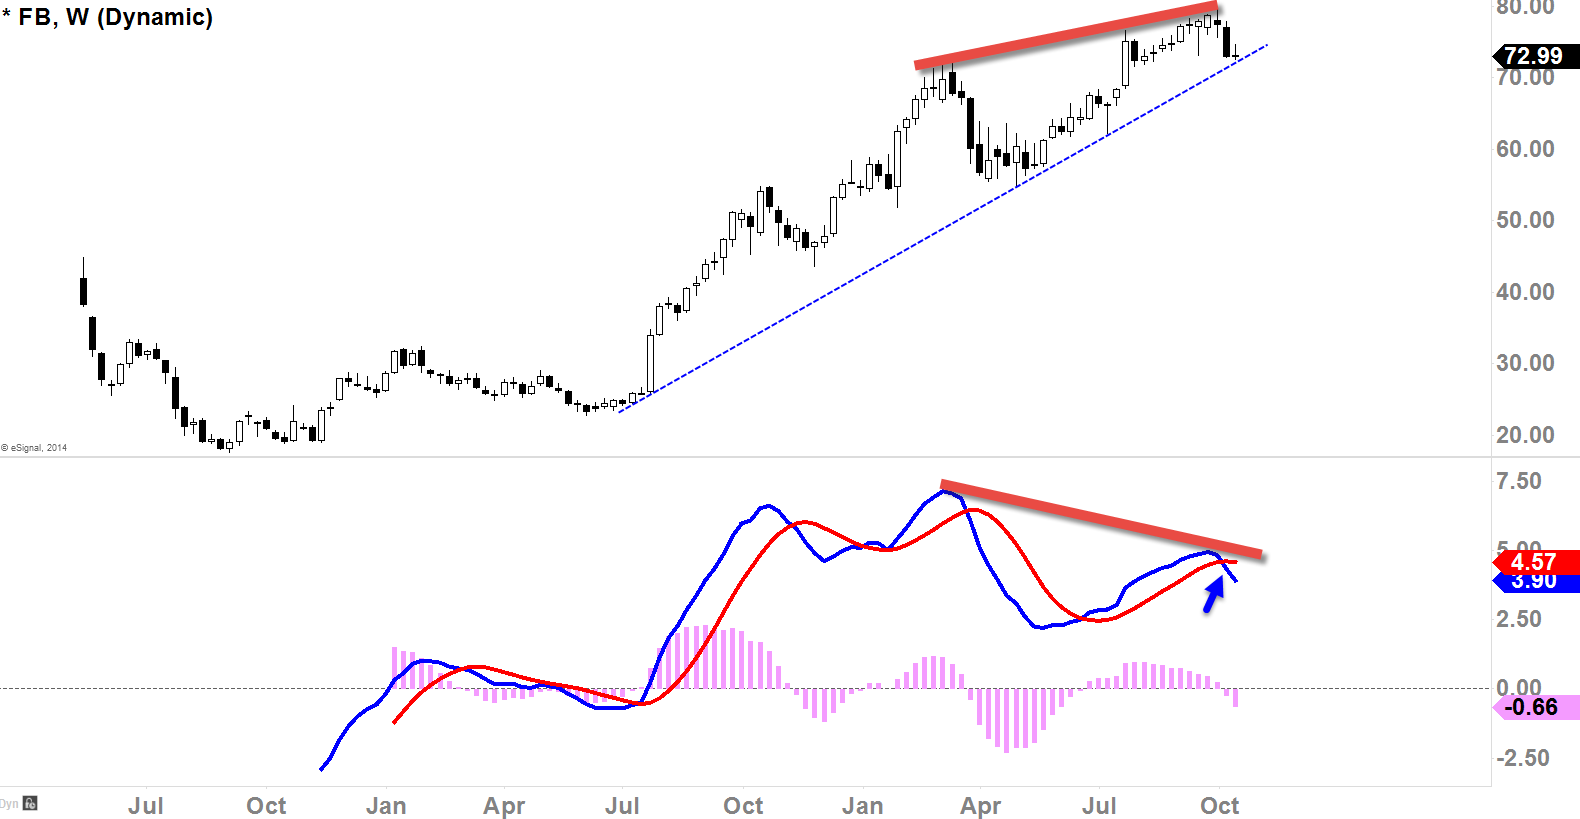
The problem we have on the Facebook is not fully confirmed with the price action as we are still holding above the rising support (blue dotted-line). But the indicator has already formed bearish divergence on the weekly term (weekly term divergences can be analyzed as intermediate and even primary-term top if its confirmed) with the recent cross to supplement that bearish pressure (see blue arrow). This weekly rising support is a ‘must-hold’ level if the bulls do not want to see the bears coming out with intentions. In the event that, the price action gets below this rising support, while the indicators continue to head downward, we might see steep decline on Facebook.
[divider]
[divider]
Daily Bearish Divergence
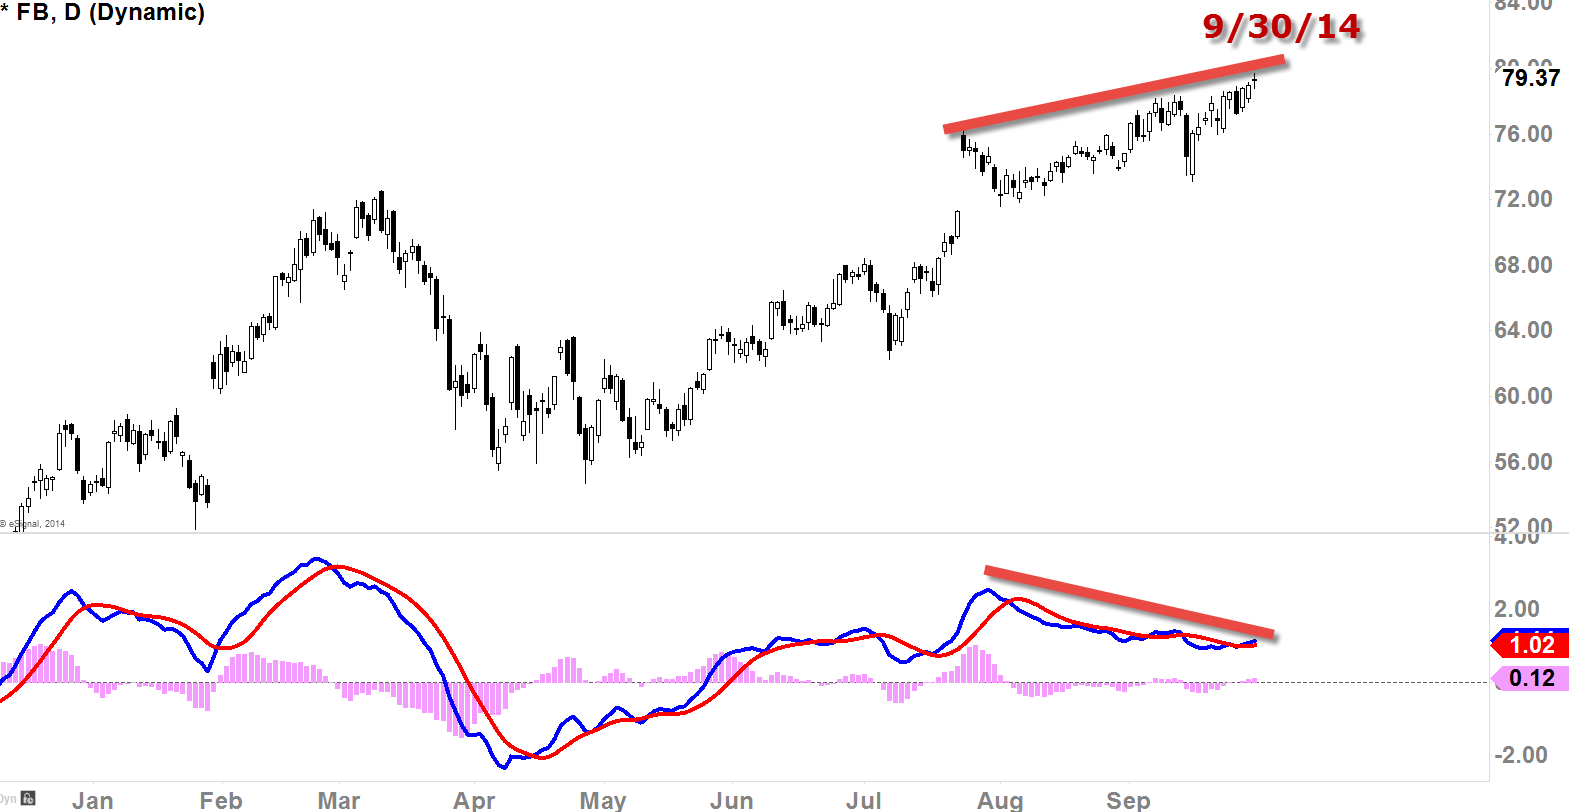
[Chart Screened on 9/30/14 @ 10:17am CT]
We’ve been long since $66ish level, and we closed all of our positions completely on the September 30th mainly because the bearish divergence is started to form. At this time though, the price action nor the indicator had full confirmation but it was insinuating (sometimes you just have to take that profit at a certain level when the slightest threat is present).
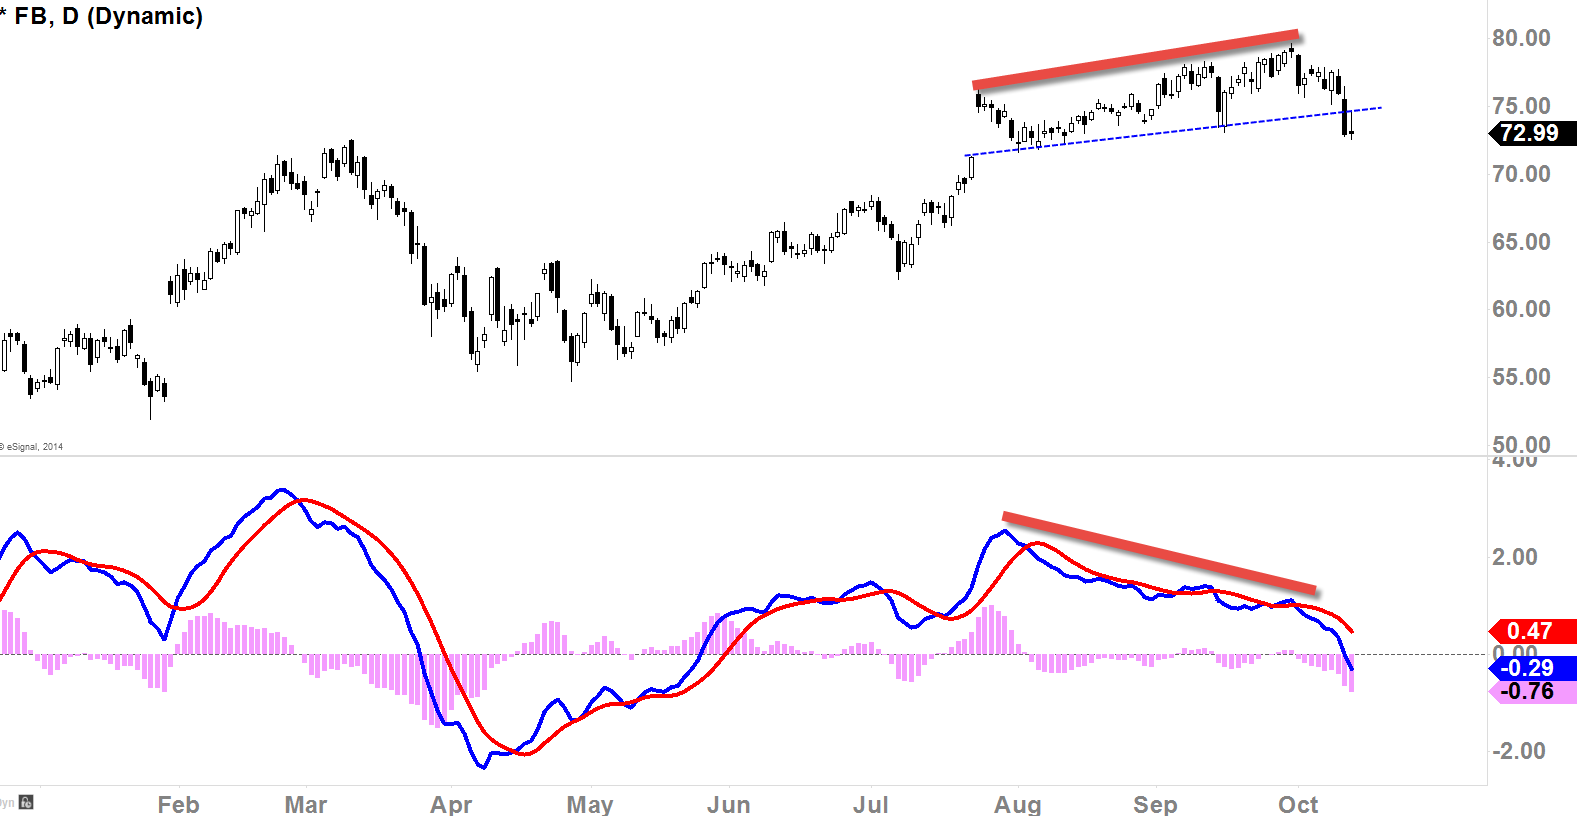
[Chart Screened Today After Market Close]
After about few weeks later, you can see that the bearish divergence has progressed confirming the price action and in the indicator. We’ve broken below recent support (blue dotted-line) but $71-$72 level is a potential support so that’s the level to look for a possible bounce. If we lose $71 level to the downside, things could escalate into much more hectic environment for the buyers.
If that weekly bearish divergence confirms, We may even see a huge decline on Facebook.