[divider]
8.03.14 Sunday
[divider]
The Levels 2 Watch
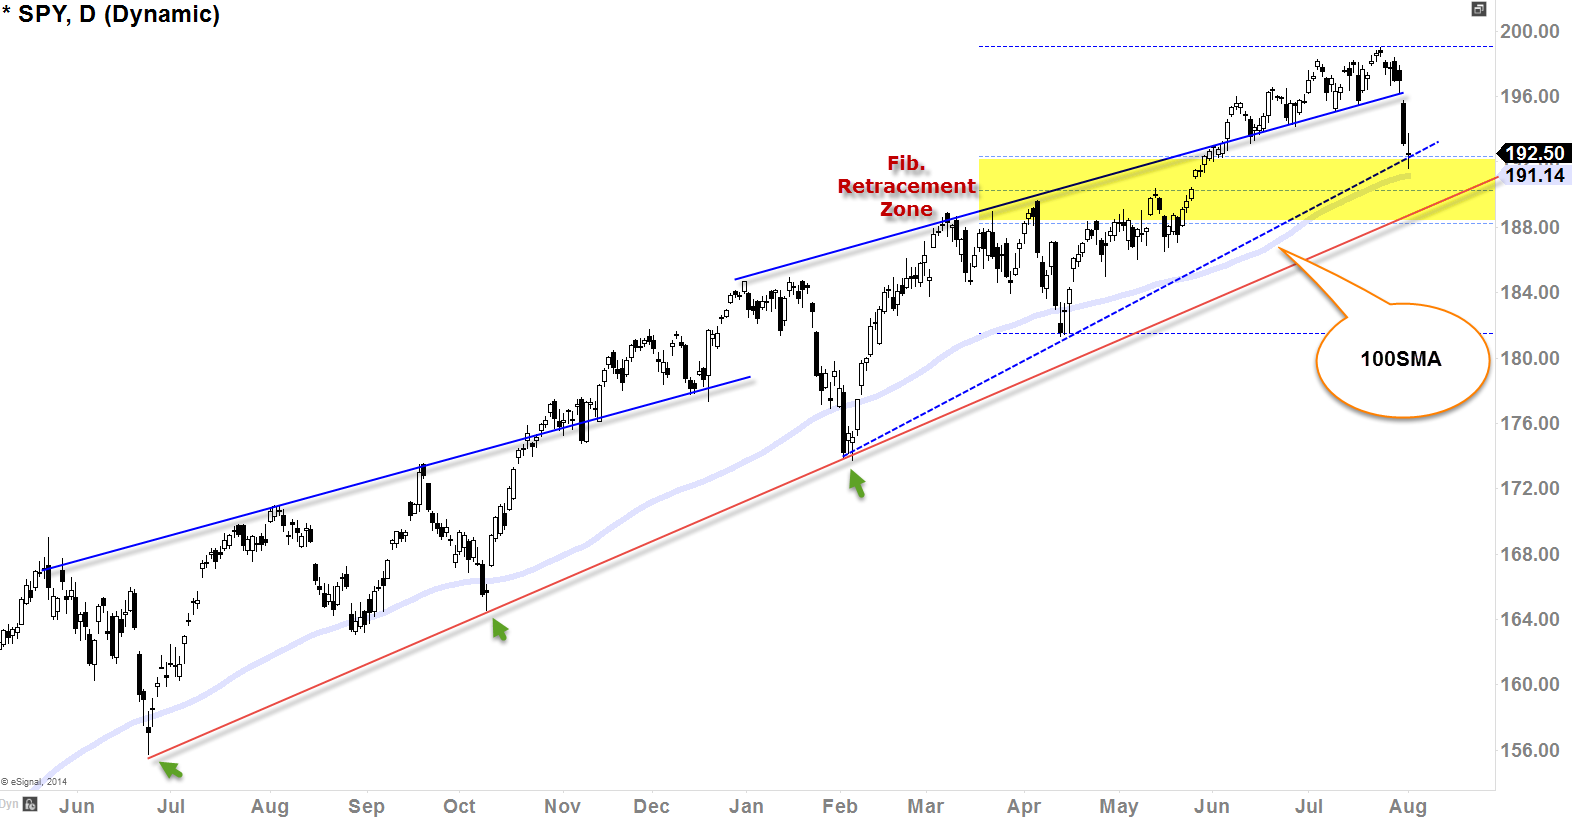
[Daily Chart with 100SMA]
We have lot of things going on in this chart so let’s break it down.
- 100SMA has been strong support since the late June of 2013. Currently, we are sitting right on it.
- Blue-dotted rising line is a potential support because it hasn’t been established yet unless we bounce right here.
- We did throw a high-wave doji candle right on that ‘potential support’ last Friday. Doji really is a wild card. It can be a reversal candle or it can just be a continuation. As of today, we do not know how it’s going to be served. If we can gap up tomorrow with bullish candle, that can be a morning start bullish reversal or if continue to the downside, that doji was just a resting pattern. I guess will find out soon enough.
- Fib. Retracement Zone (yellow highlighted) is a potential level to look for a bounce. It is conveying the fact that as long as we bounce at one of those levels, the primary uptrend will continue.
- If #1-4 fails, we still have that strong uptrend support (rising red line – see green arrows)
[divider]
The Impartation of RSI
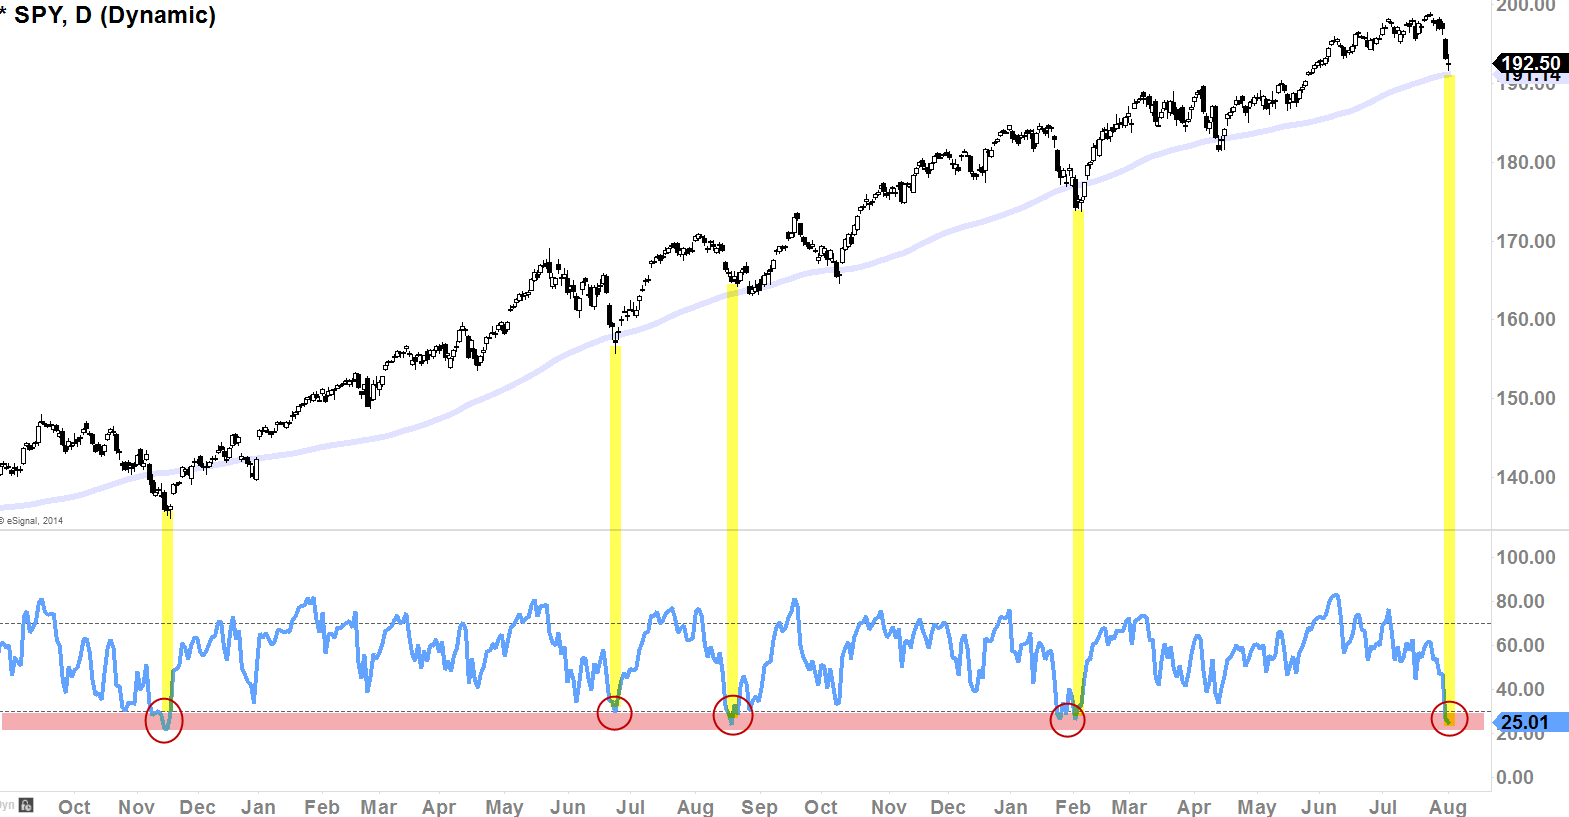
[Daily Chat with 100SMA & RSI Indicator]
It’s interesting to look at RSI along with 100SMA because it has been on-point (see yellow highlighted) for sometime now. This means we do have high probability of a bounce here because it has been served as strong level of a bounce since late 2012. We have been in such a bullish trend that, S&P 500 Index ($SPY) has only touched ‘oversold status (20-25 readings)’ on RSI only 5 times (including today) since late 2012. That’s a strong uptrend. What we have to understand about the indicator is that, it CAN stay at ‘oversold status’ for weeks and months. This does not mean it has to bounce so I am looking for a price action to confirm the RSI’s insinuation today. Next 2-3 days we might have better idea. I will try to update this post as it progresses.