

[divider]
Last Update: 6.30.14
[divider]
Related Article
9.5.15 “My $TSLA Calls”
[divider]
6.17.14 Tuesday
[divider]
[The Daily] Important Technical Facts
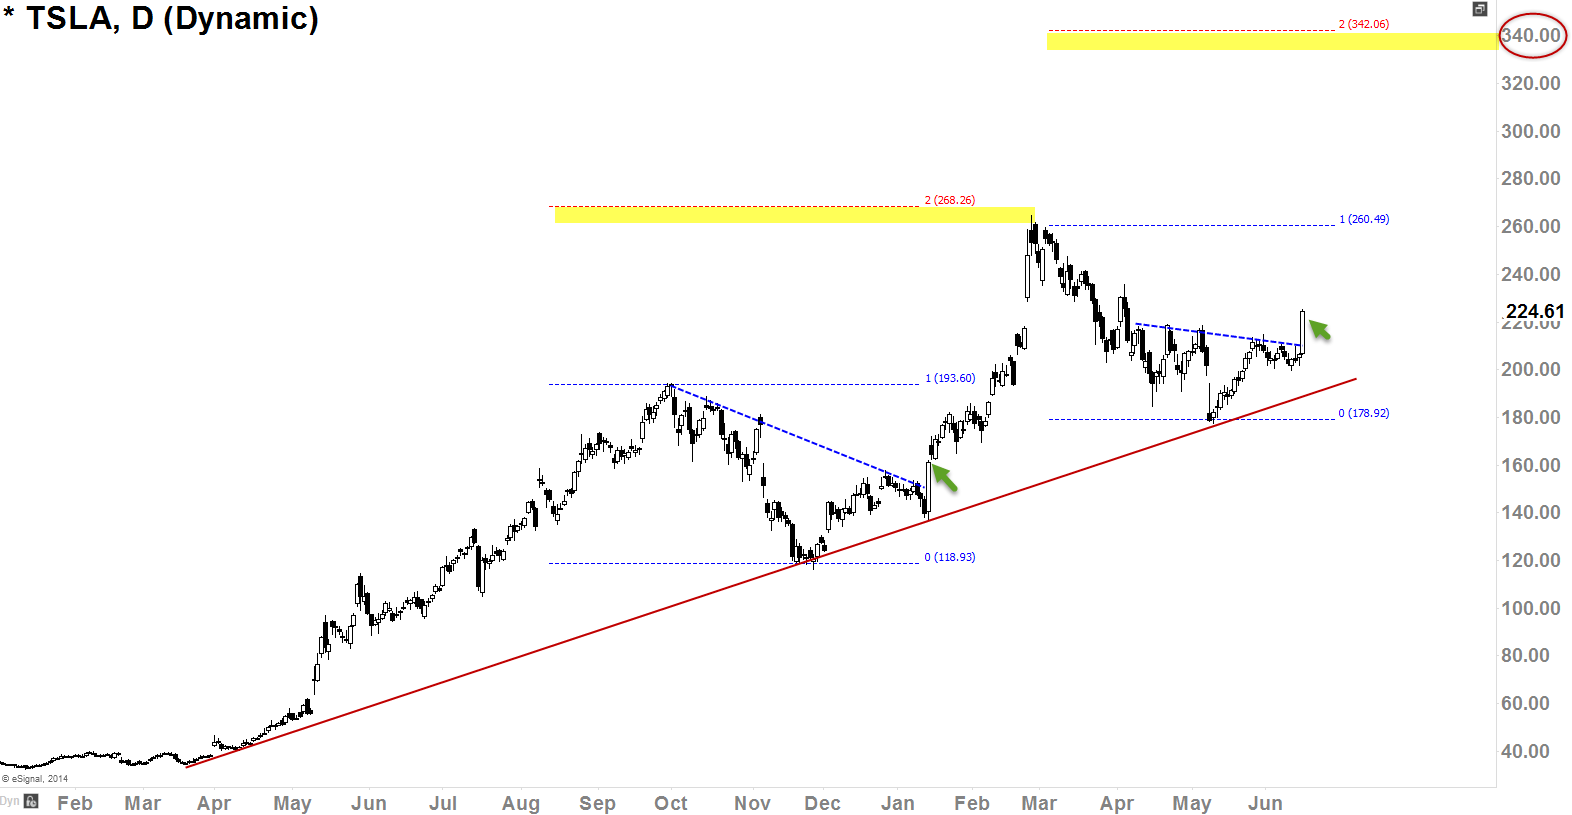
I see several things in the technicals that could help us to gauge and forecast
- Uptrend support held and sustained (red line)
- Yesterday, broke-out to the upside with authority above the resistance level (blue dotted line)
- Last time (1/14/14) when it broke-out (green arrows) after a correctional move, Fib. 200% level was precise target (yellow highlighted)
- Today, we have very similar scenario happening on this stock (much like mid January), and I think it’s possible that we get to $340 level.
[The Weekly] Oscillator’s Implication
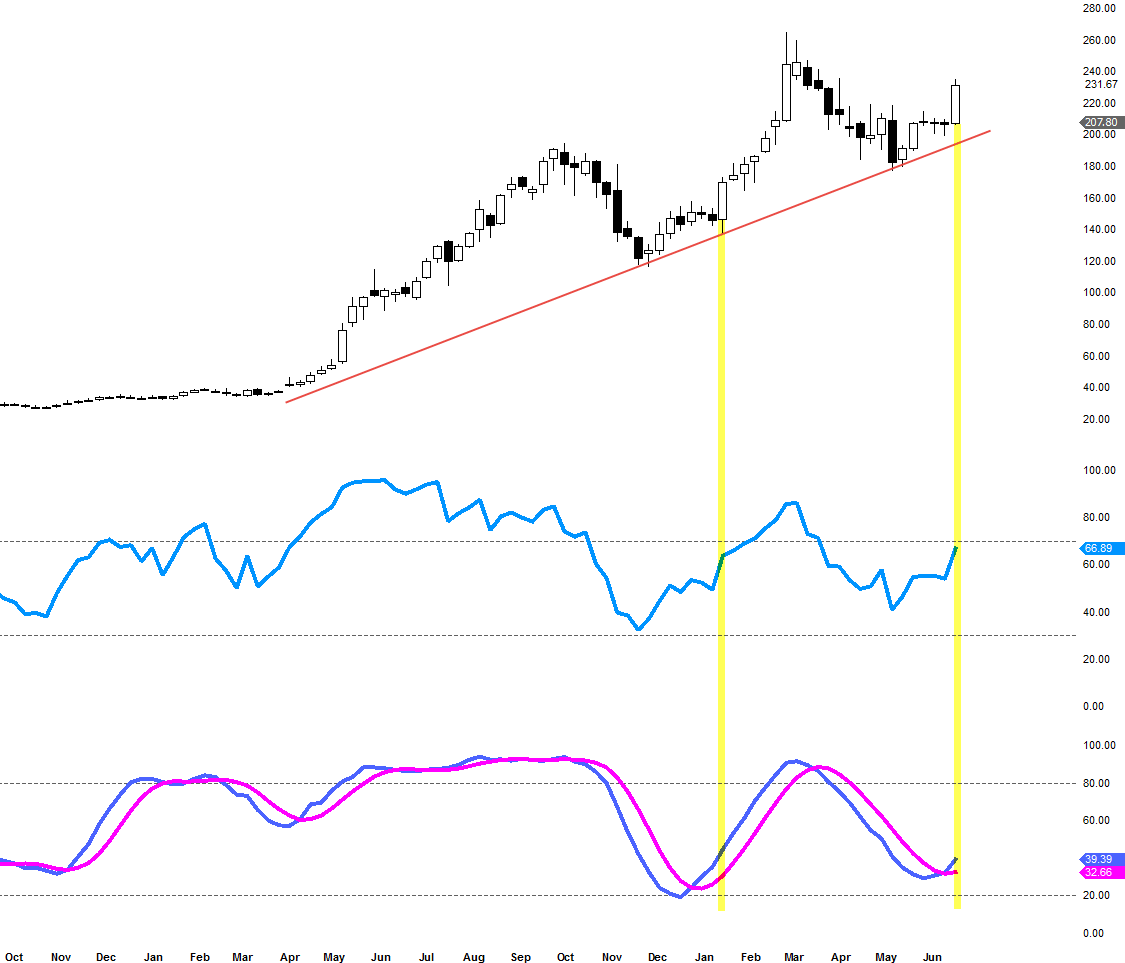
Besides the fact that they are showing “buy” signals, what caught my eye was how identical there locations are along with current price action and the January price action. That tells me, we are dealing with very similar sentiment here as I have noted earlier on this article. I’d say following daily 10/20EMAs as a guide to swing trade 1-2 months might be a good strategy.
[The Monthly] The Big Picture
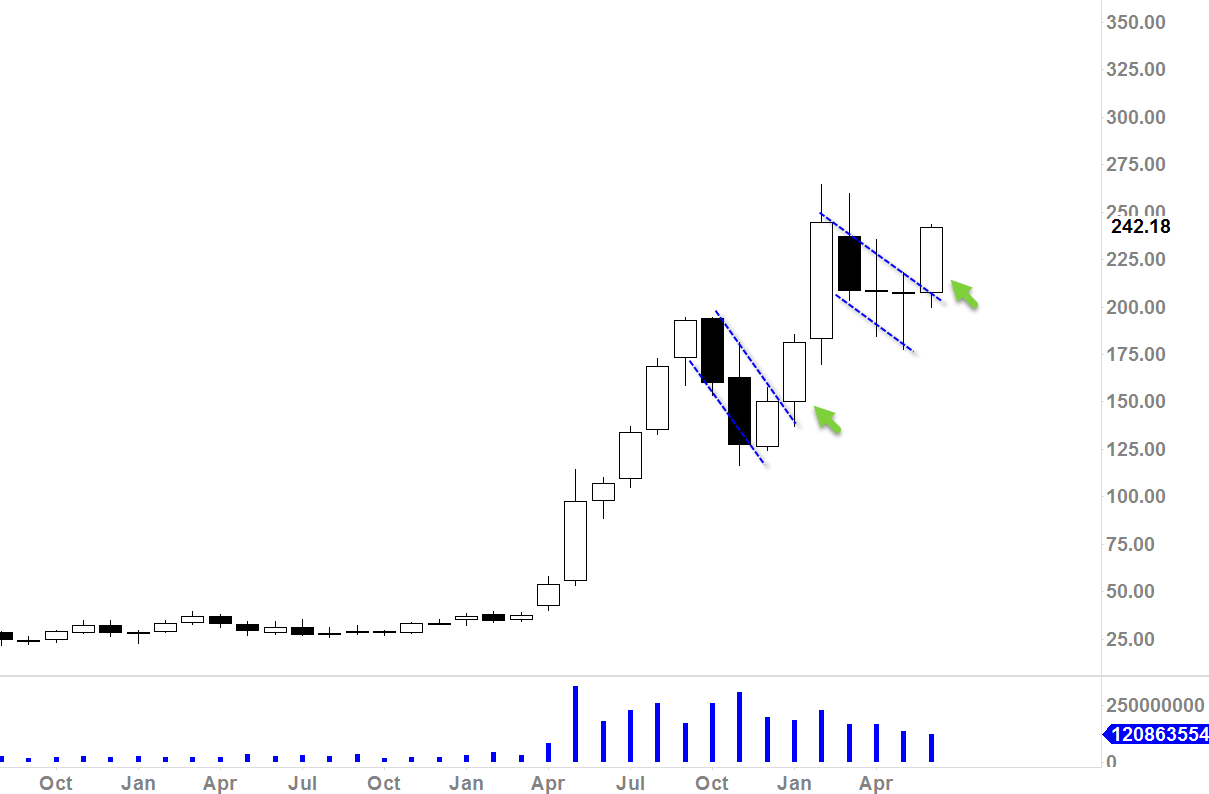
[Screened on 6/30/14 @ 10:30am CT]
This is the month-ending monthly chart for Tesla Motors, Inc. screen captured this morning. This is what we call a Bull Flag continuation pattern (very similar sentiment to September 2013 through Jan 2014 action (see arrows)). With this month’s awesome looking candle, we have confirmed Bull Flat breakout. With this signal, looking at the big picture, I perceive that Tesla continues higher possibly reaching our target of $340.00.