[divider]
Last Update: 12.8.13
[divider]
Related Articles
10.22.13 “$AAPL Two Charts with $530 Resistance Warning“
10.11.13 “$AAPL Ready 2 Explode“
10.10.13 “AMAZINGLY BULLISH $SPY $IWM $XLF $AAPL [VIDEO]“
09.23.13 “$AAPL Levels I am Watching (Part 3)“
[divider]
11.14.13 Thursday
[divider]
Weekly Chart 1
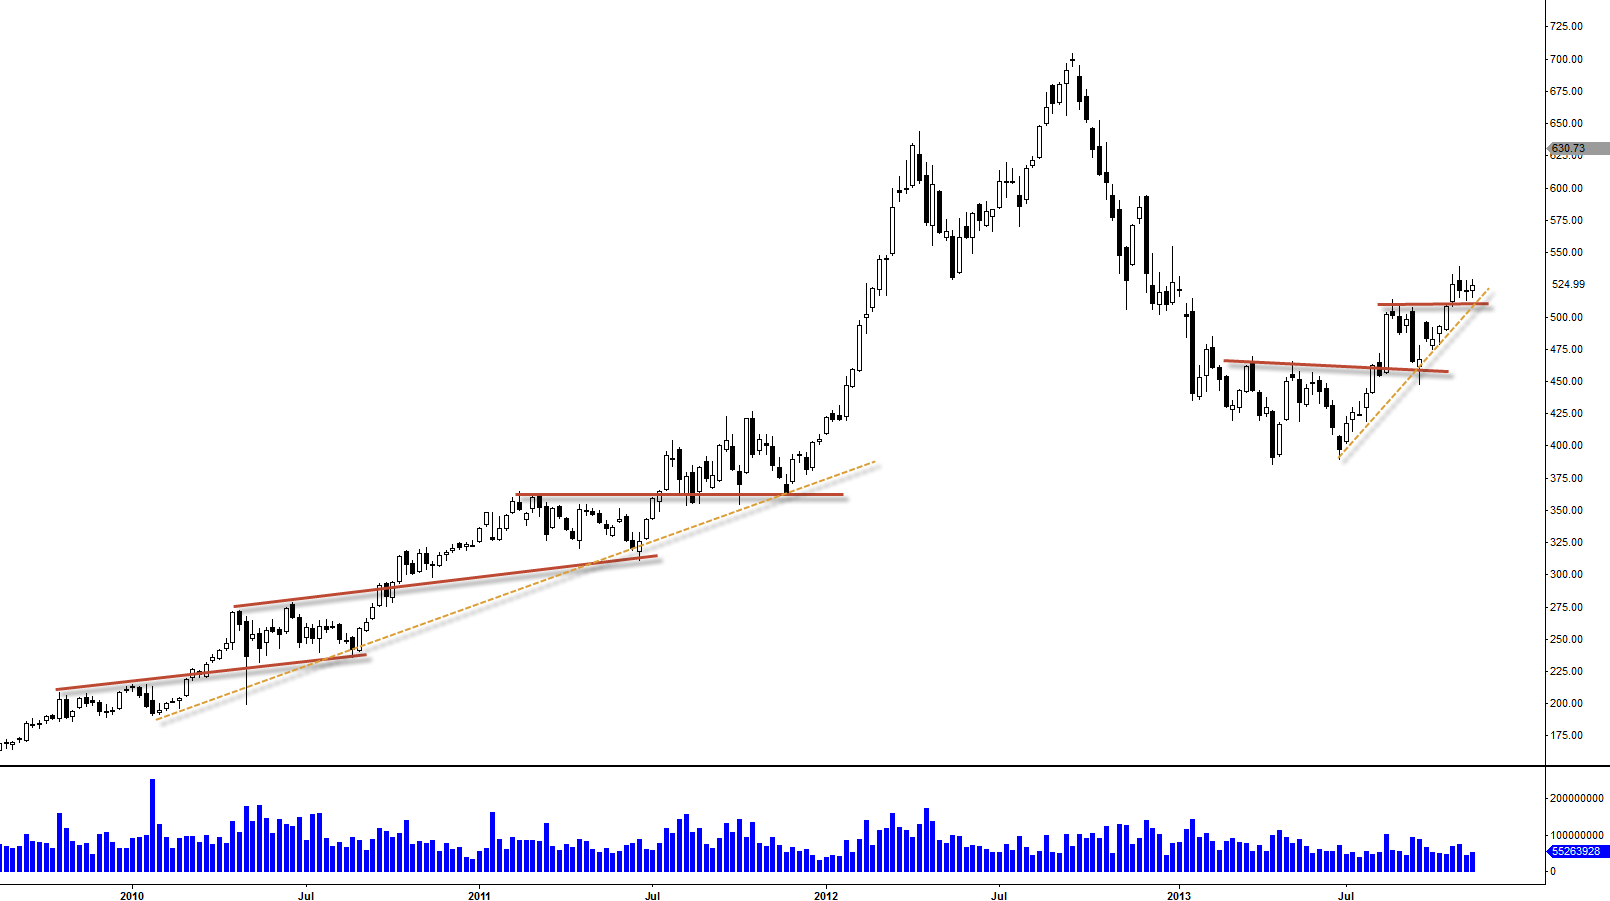
$AAPL loves to stair-step higher once the trend starts to develop and obviously we have seen the trend built and continue to build as this uptrend is still very well in tact. I would have to say as long as $505-$510 level holds as support, I do see higher prices looking at the bigger picture here.
Weekly Chart 2
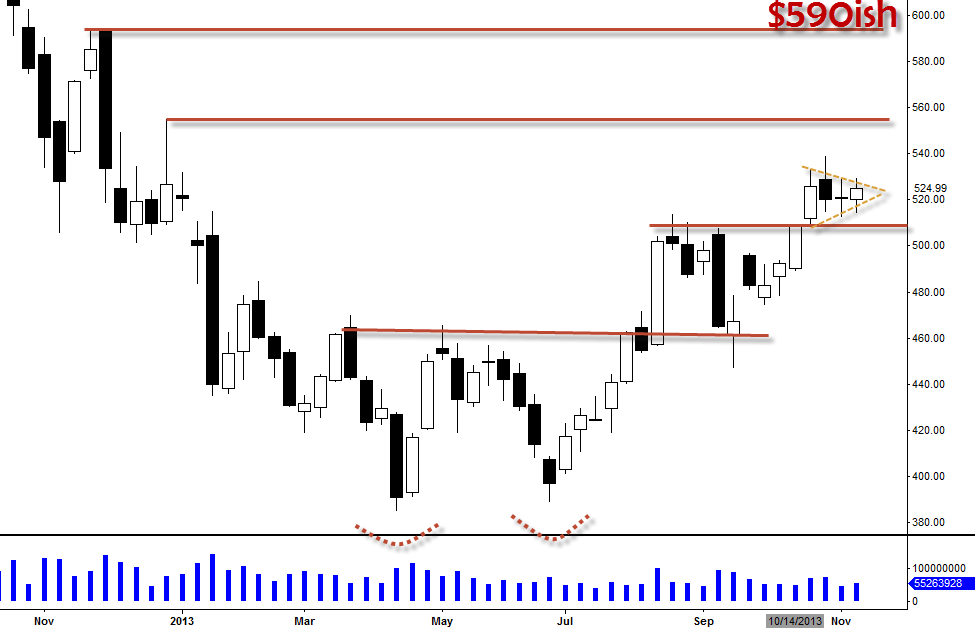
Last 4 weeks, we’ve pretty much consolidated forming bull pennant pattern above the pivot area. This is a very good sign for buyers as these kind of consolidations usually results in upside breakout, especially, after we’ve found strong support with double bottom reversal several months back. As you can see, we are progressing to the upside and making higher lows. Trend is definitely well established and momentum is continue to be built to the upside.
$550, $570 (see the chart below), and $590 are the next three targets.
[divider]
Old Support New Resistance
Weekly Line Chart
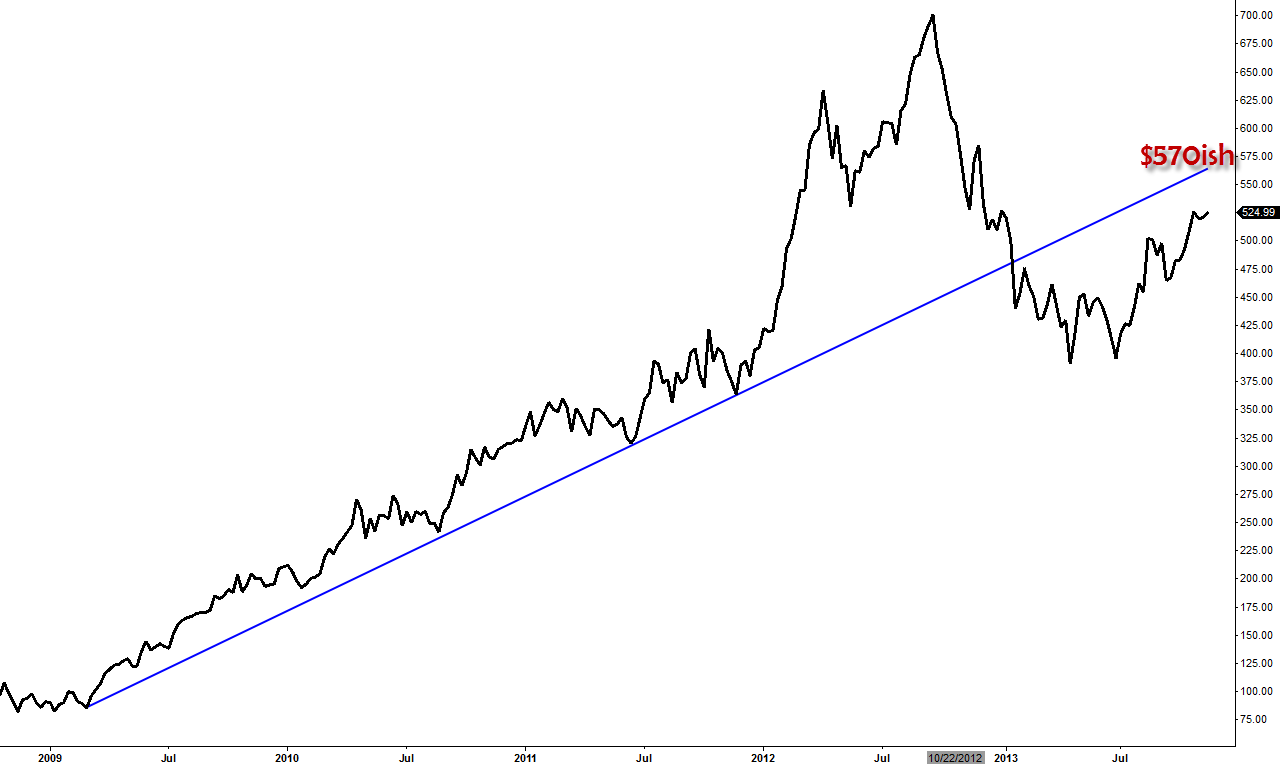
Old support new resistance might be happening here at around $570 and it can become pretty significant resistance level. So must be on guard on this level if or when $AAPL get up to the price level. We must break above this level to get up to $590.
[divider]
12.8.13 Sunday
[divider]
High Volume Weekly Doji
Weekly Candle Chart
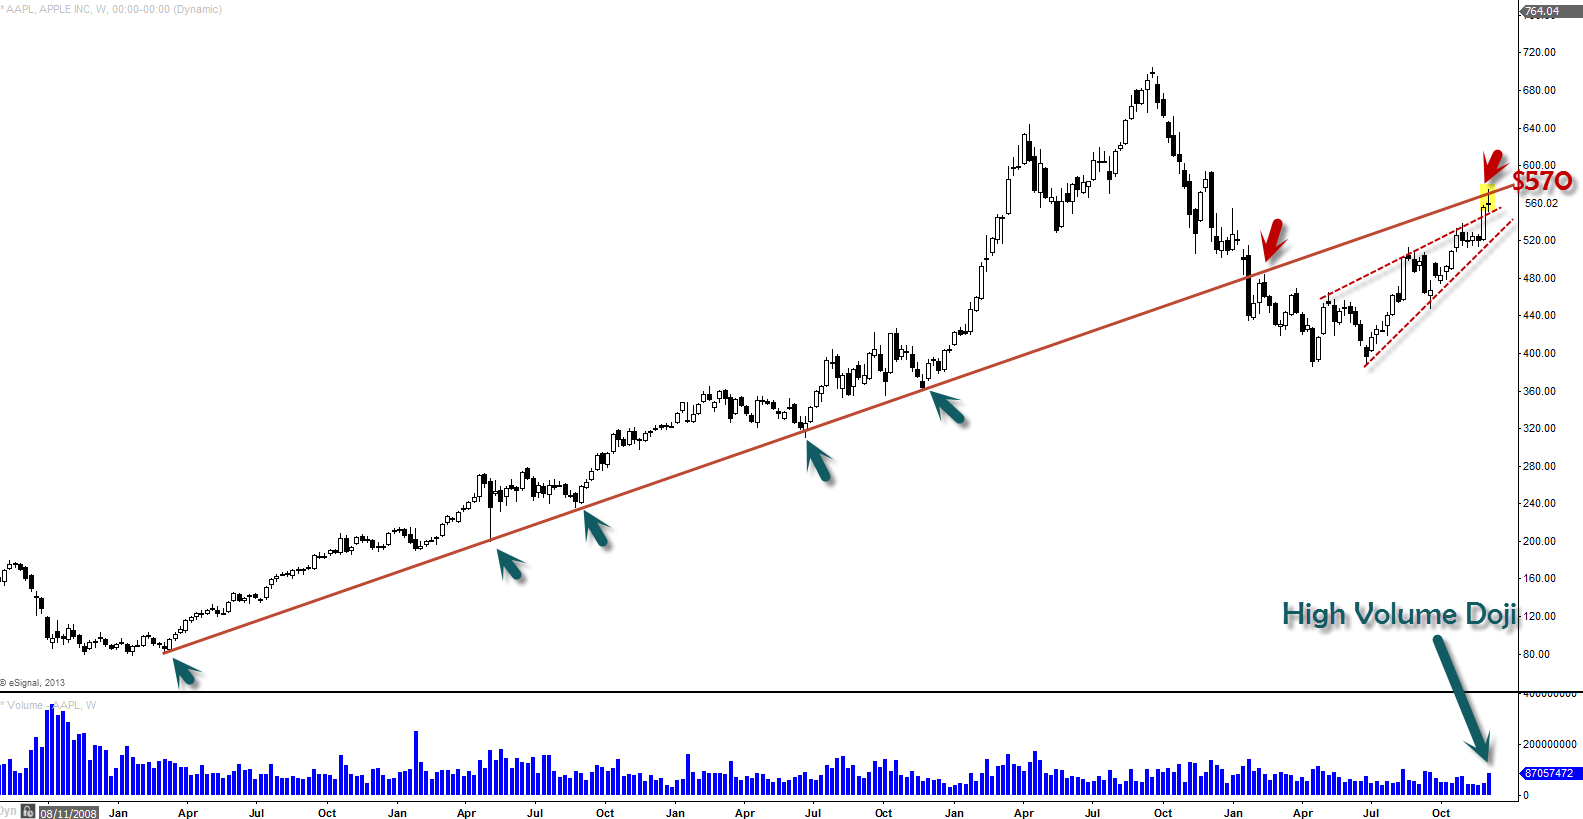
So here are few things to consider
- $570 pivot level
- High volume Doji on the weekly chart right on that $570 pivot
- High volume indicates, this Doji CAN be dangerous (could be Evening Star reversal (if follow through next week to the downside)
Here are few scenarios for bulls
- Make sure we do NOT close below lows of last week by end of this week with full bodied bearish candle (doji or spinning top should be ok)
- Consolidate here forming either bull flag or bull pennant
[divider]
Levels 2 Watch on Daily Chart
Daily Candle Chart (10EMA: Light Blue | 20EMA: Green)
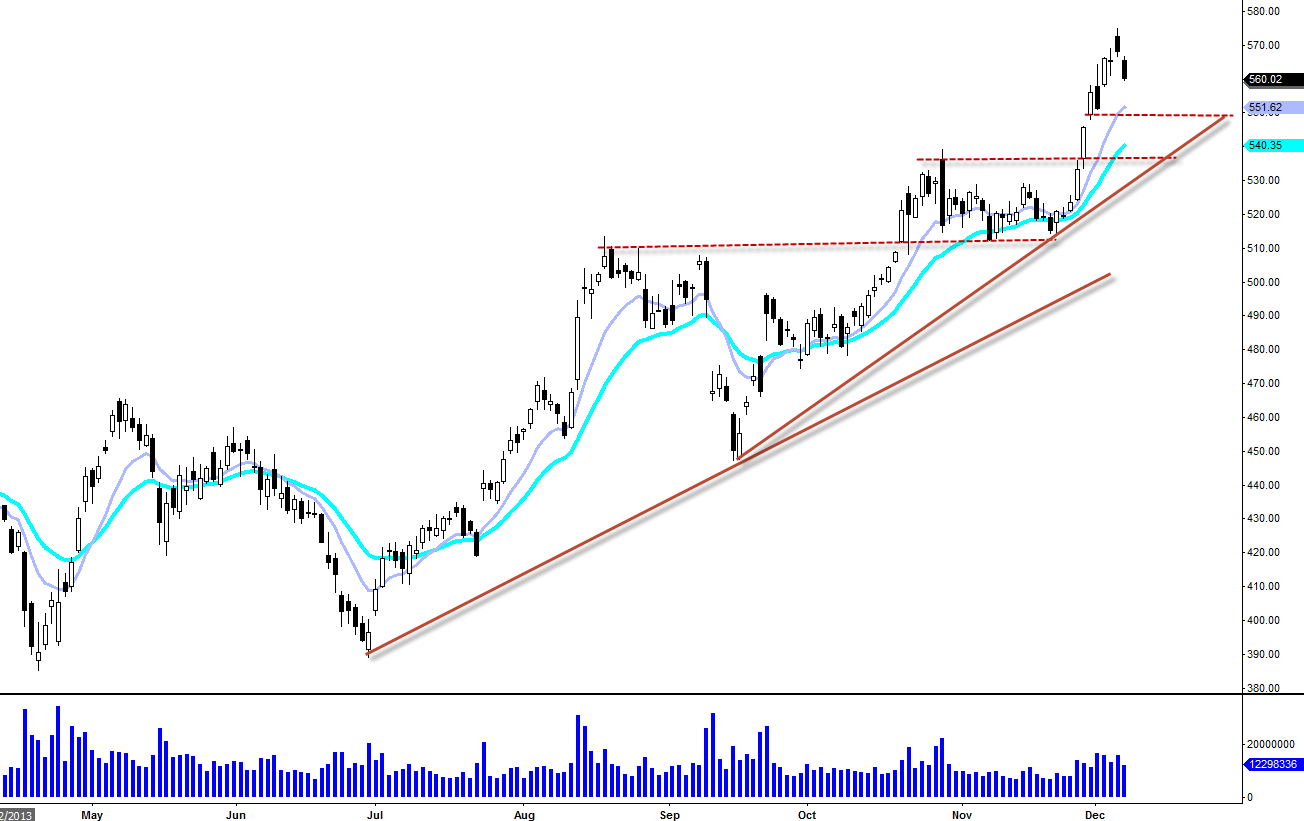
Here are levels to watch for supports
- $550ish (10EMA) support
- $540ish (20EMA) support
I would wait until for a confirmation of a bounce for continuation but definitely not the level to short (unless day trading)