

[divider]
Last Update: 10.13.13
[divider]
Related Articles
8.25.13 “How I Traded $AAPL from $403-$499”
10.10.13 “AMAZINGLY BULLISH $SPY $IWM $XLF $AAPL [VIDEO]”
10.11.13 “$AAPL Ready 2 Explode”
[divider]
9.23.13 Monday
[divider]
Next Level: $515.00
*Daily Chart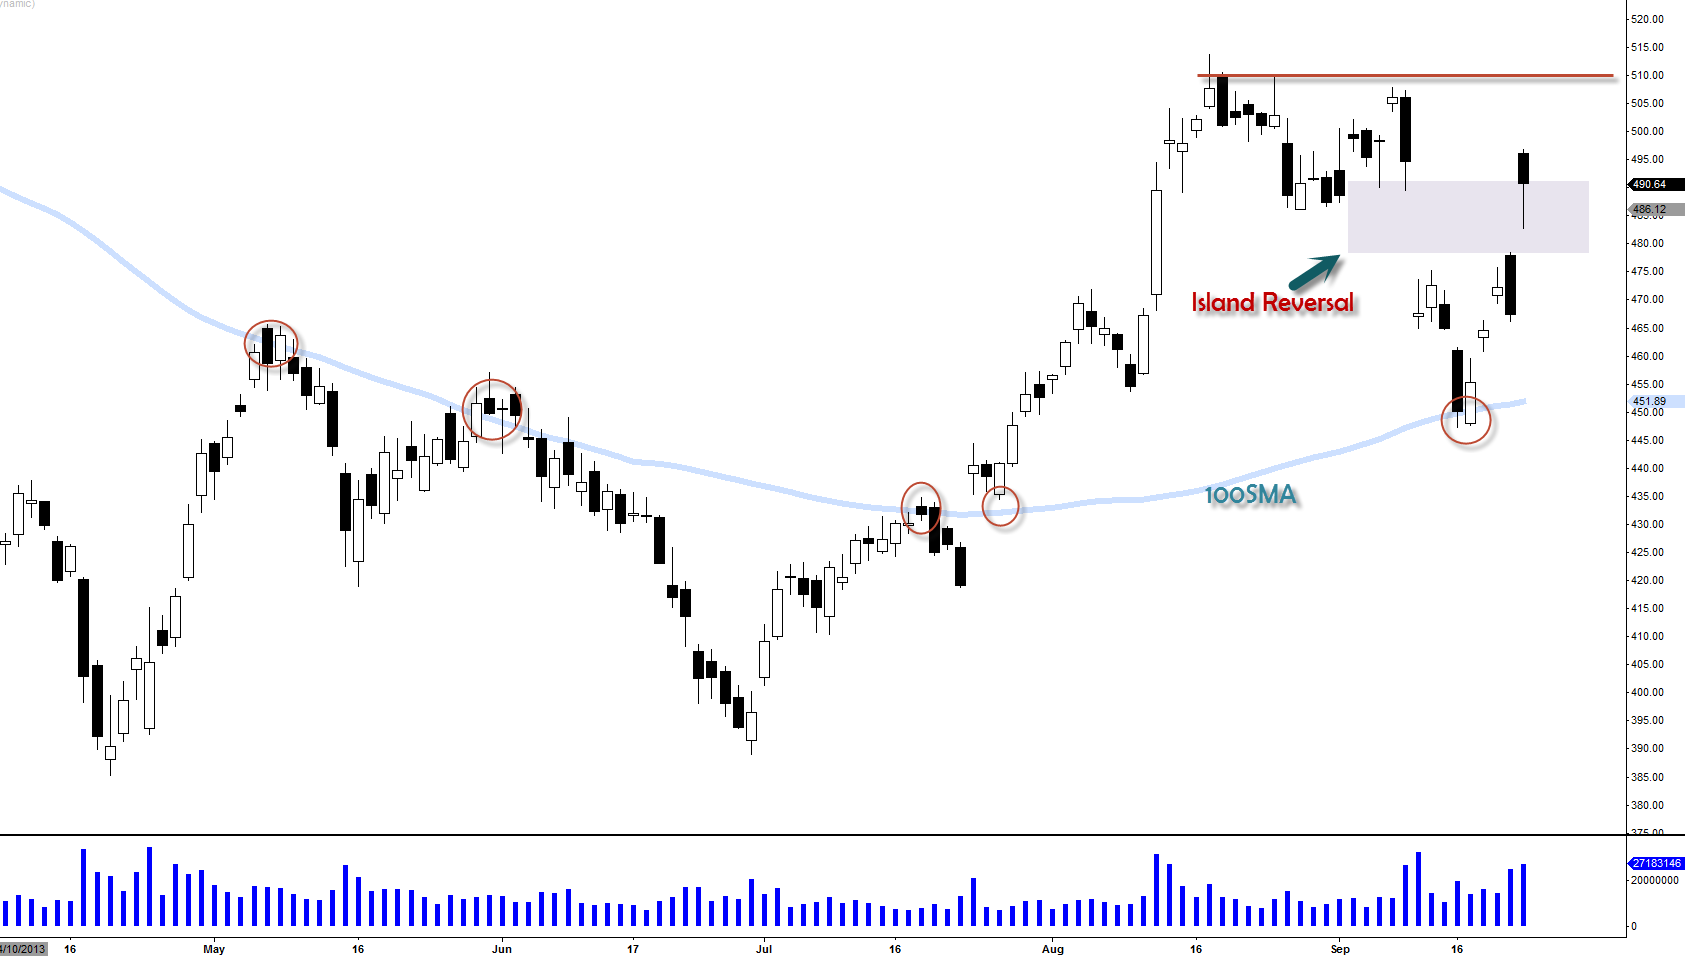
As we’ve been talking about $450-$454 level being very important level on the last article (click here) because of many vital signs that were coinciding at that level, I think we’ve seen some great bounces right at that $450 level where 100SMA is residing.
As you can see 100SMA continue to maintain pretty impressive resume acting as pivotal level for $AAPL (see circled) since early Mary. Sure enough and yet again, we’ve bounced off of 100SMA on this daily chart on 9/17 and we started gapping higher every day for the last 4 days since 9/17.
What impressed me the most about last 4 days action is how it managed to keep the gaps open and kept moving higher. Today with huge gap up after the weekend sales numbers, $AAPL was able to stay up today without filling the gap which means, now we have potential island reversal that can be played out by the bulls (island reversal is one of the stronger reversal pattern). And yes it might still be too early to say that the island reversal is going to truly play out because bears can fill that gap tomorrow or this week however with today’s price action, I can’t help to think that we probably going up to $510 level soon here. And during that process, the island reversal will continue to support the move to the upside.
Again, bulls task must remain to preserve the gap and make sure bears do not close the gap that was opened this morning so that the bulls can continue to cultivate this recent rally.
Ideally, I would like to see this thing consolidate for about 2-3 days above $486 level before thrusting higher and I don’t think it would be such a good idea to have another gap up tomorrow morning. We would need some “settling down” action holding above $486 level. If we can do that, I do believe we can see much higher prices.
$510-$515 will be the next level of resistance to watch and if we break above that level, I do think we are going to $530 level and ultimately $550.
Next Level if $515 is Breached: $530
*Weekly Line Chart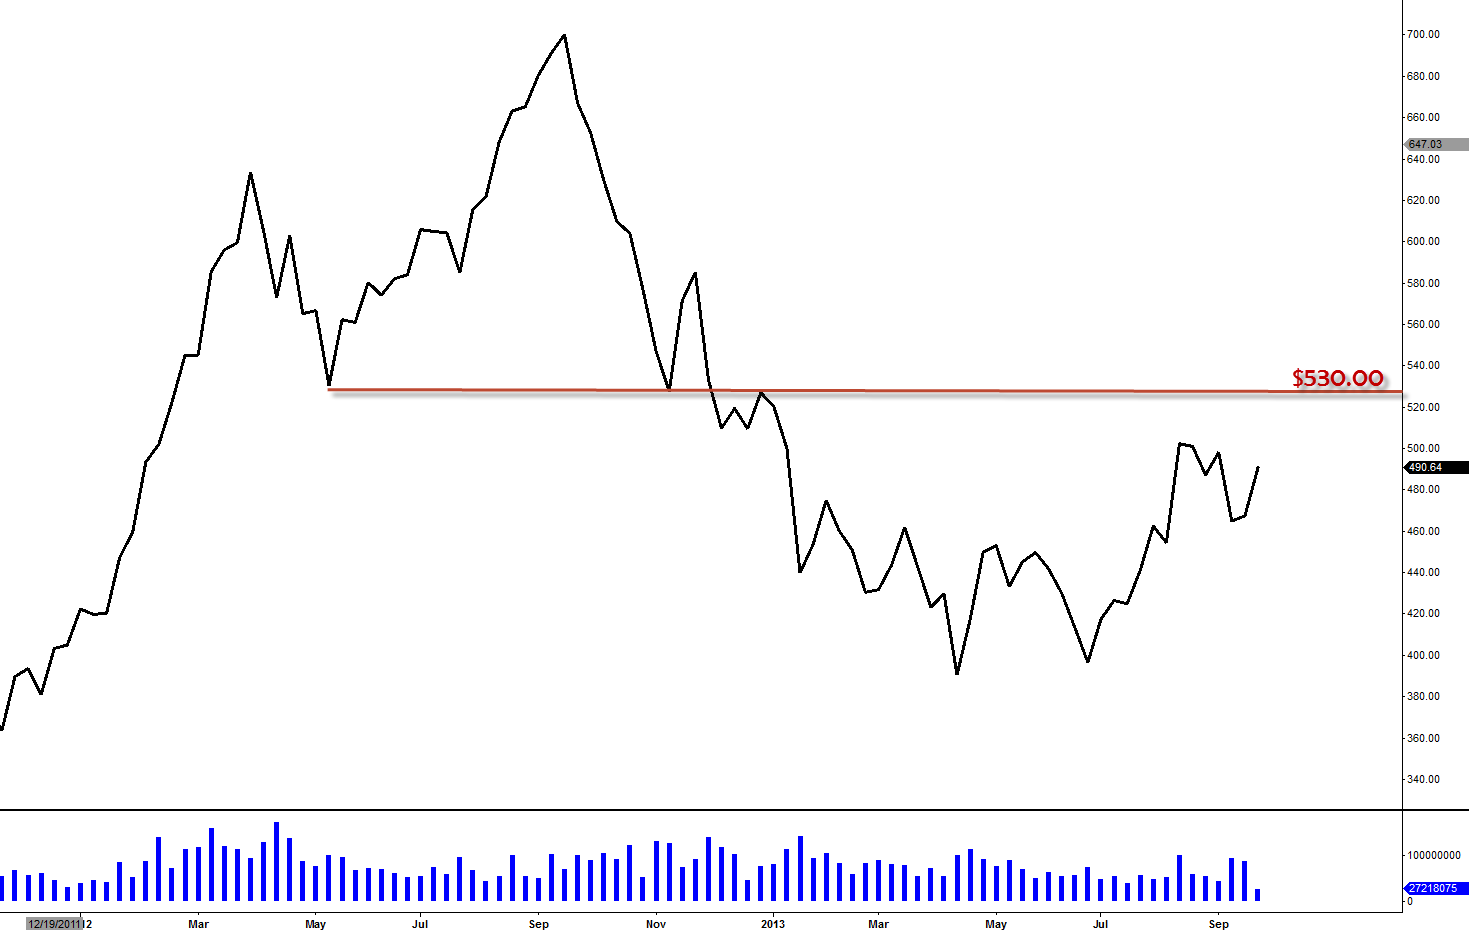
Weekly H&S Neckline level could act as resistance. This is the pivot level that has been respected when we formed that huge weekly H&S reversal formations back in early December of 2012 and certainly I wouldn’t ignore this level as possible resistance.
Double Bottom Measured Move $530
*Chart screened and analysis added on 10/12/13 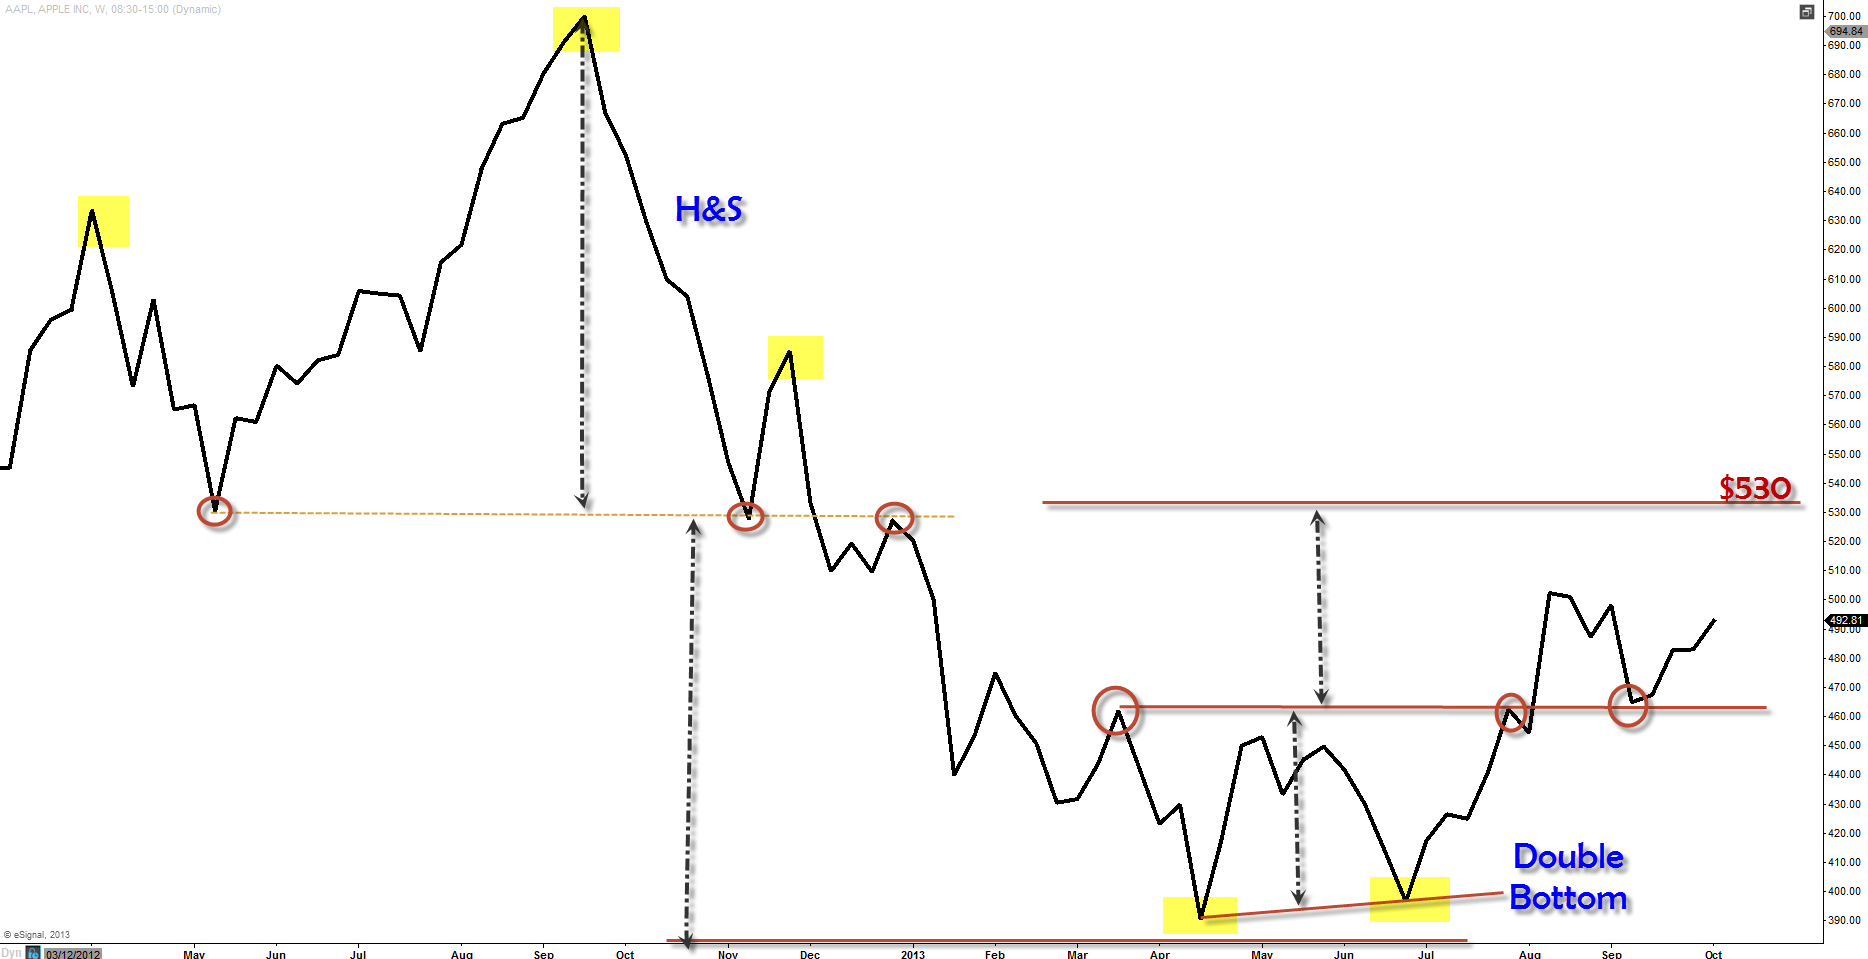
(Weekly Chart)
- H&S Measured move was about $360 and $AAPL bottomed at $380
- Double Bottom measured move is $530 measuring from the perceived neckline
Next Level if $530 is Breached: $550
*Daily Chart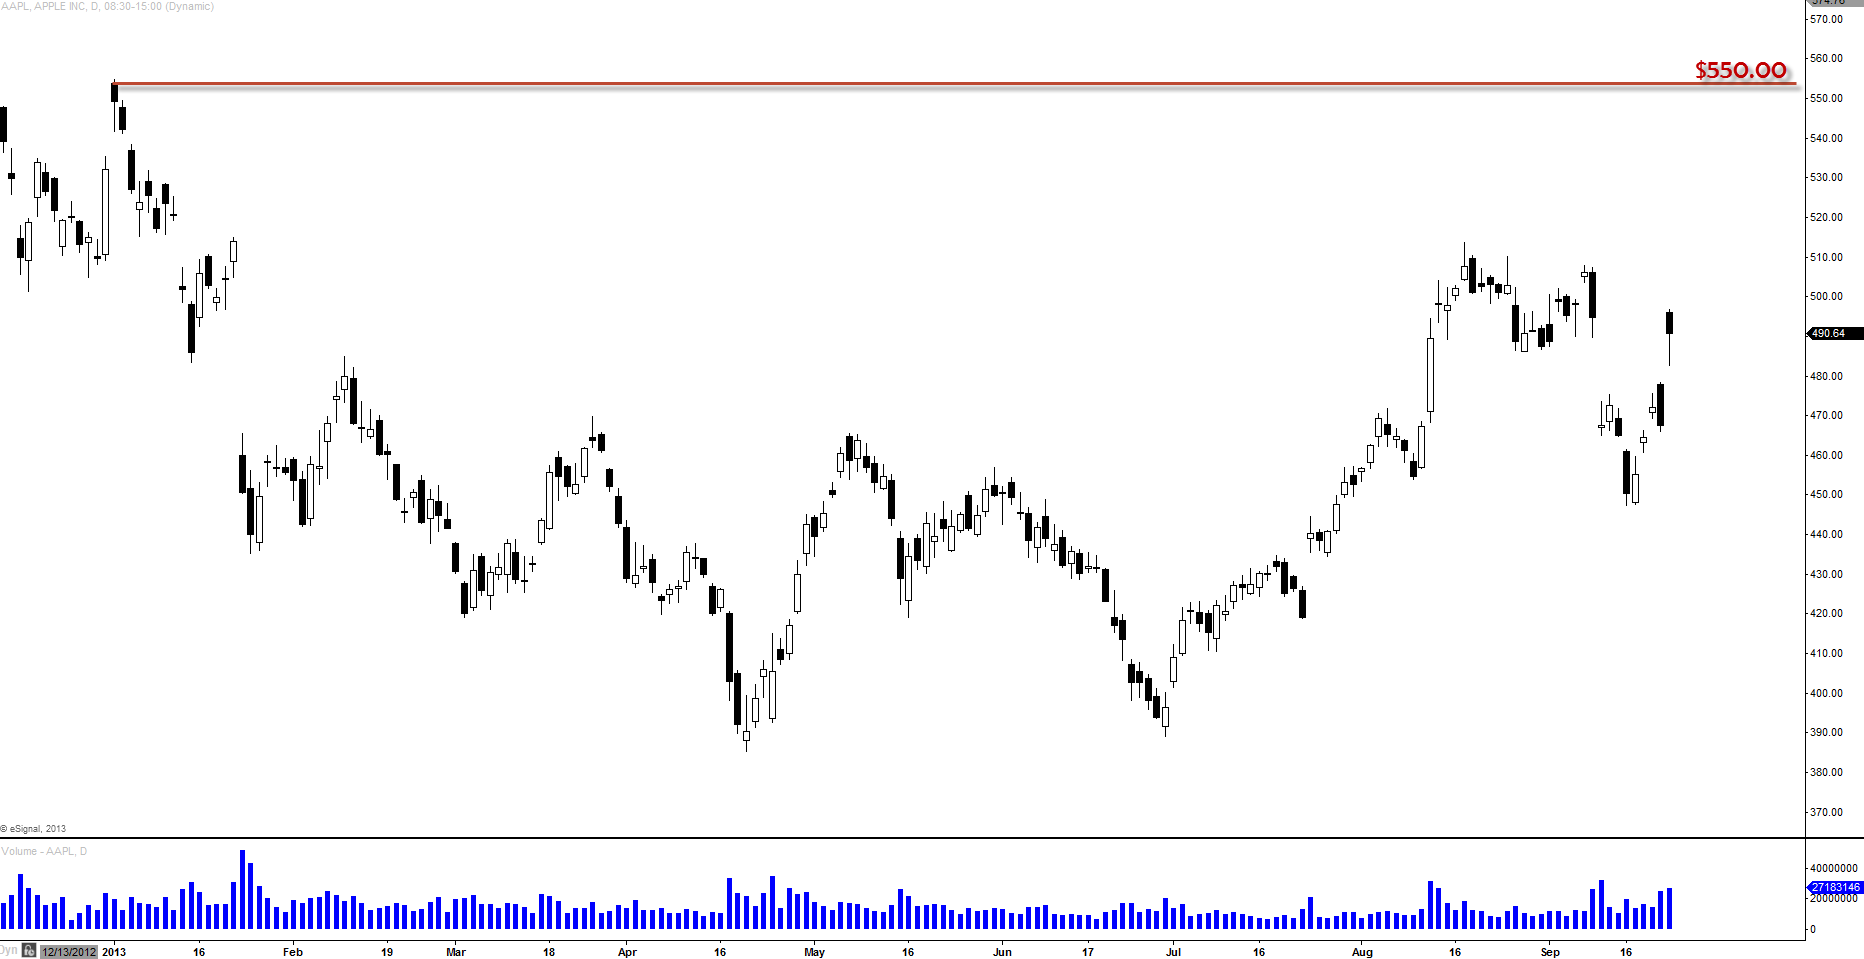
If we can break above $515 and $530, the next level to watch would be $550 which I think it can become ultimate target before the next ER. I do think $530 will slow things down and we might get a pull back here and there but once we bust through $530, $550 will be a good level to watch.
Old Support New Resistance $550
*Daily Line Chart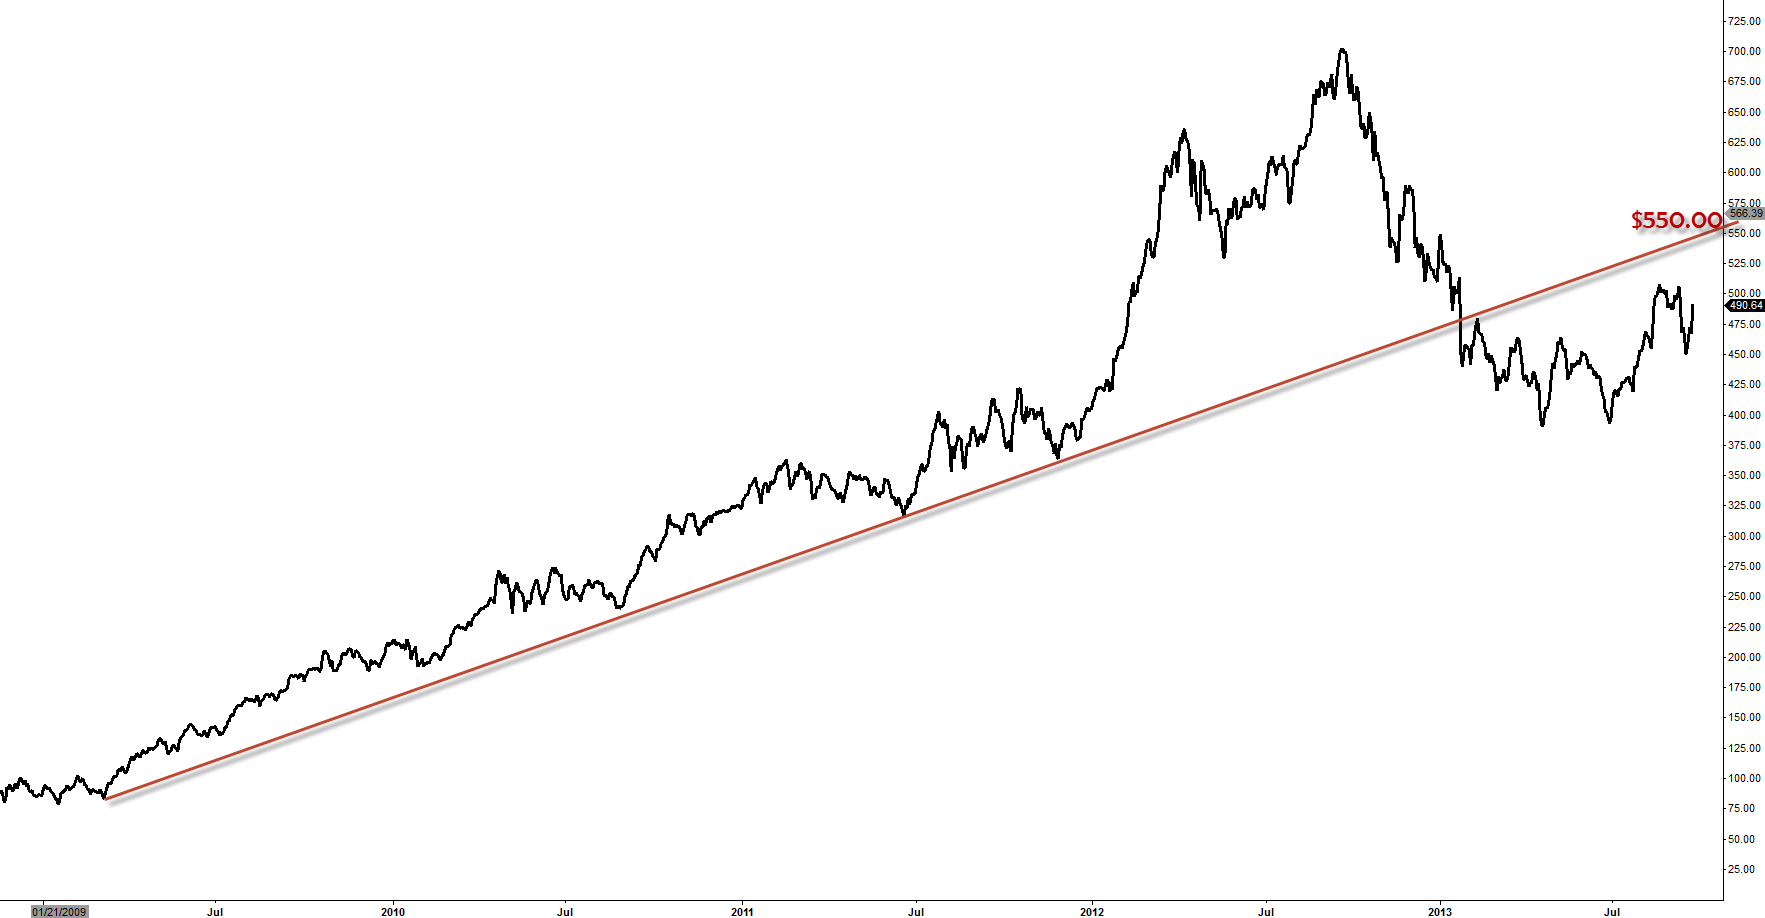
Check out this long term uptrend support that could possibly become new resistance which is coinciding with that horizontal resistance level $550.
This is why I think $550 is going to be that ultimate target before it pulls back hard. This uptrend line has been served as strong support for quiet sometime so I wouldn’t be surprised to see this uptrend support acting as new resistance. Definitely level to watch.
Fib. 50% Retracement Level $550
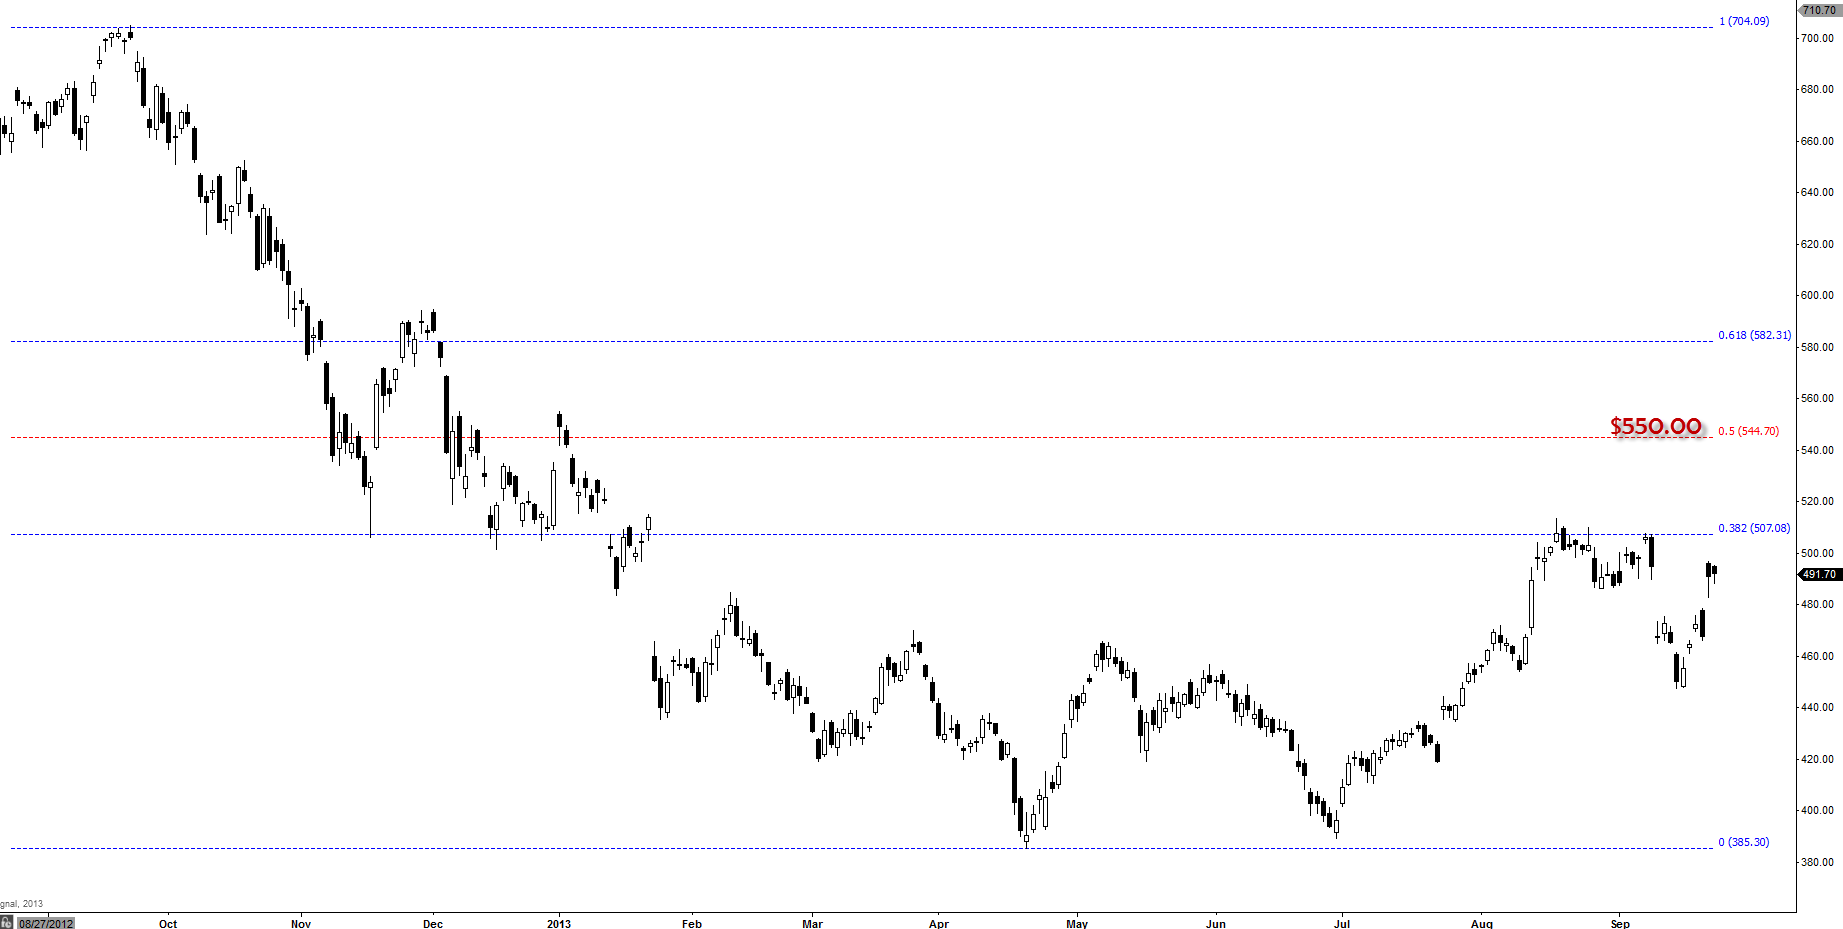
Like I talked about on my last article why $450 level was very important level if $AAPL was going to bounce because so many different analysis was confirming that price level. Well now we have similar conclusion here with the price level of $550 as we have horizontal support level, old uptrend support level and fib. level all coinciding and in syncing and pointing to $550. Once we break above $515, I do think it’s going to pick up some speed to reach $550 but $530 will trying to slow things down but ultimately I think $AAPL is eyeing on $550 before the next ER.
[divider]
Bonus Charts
[divider]
Oscillators Insinuation
*Chart screened on 9/24/13 after market close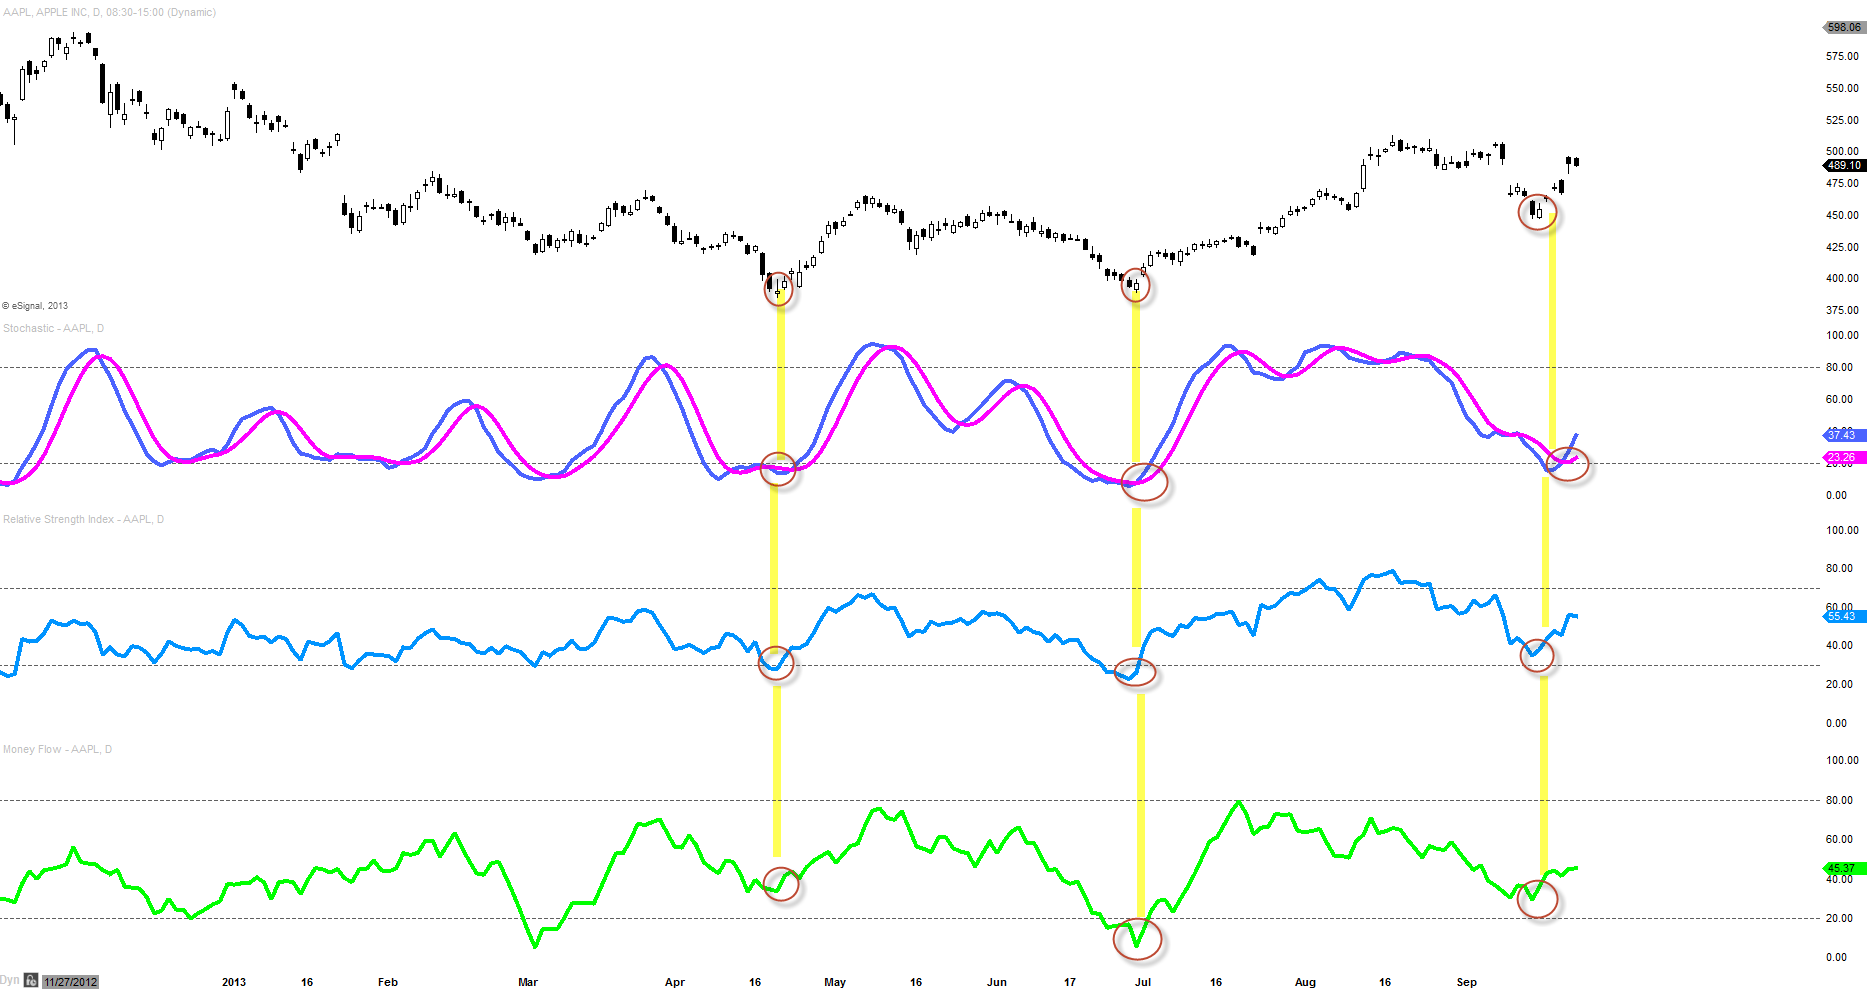
Daily Full Stoch, RSI, MFI
[divider]
B-Bands Middle Line
*Chart screened @ 12:35pm CST on 9/26/13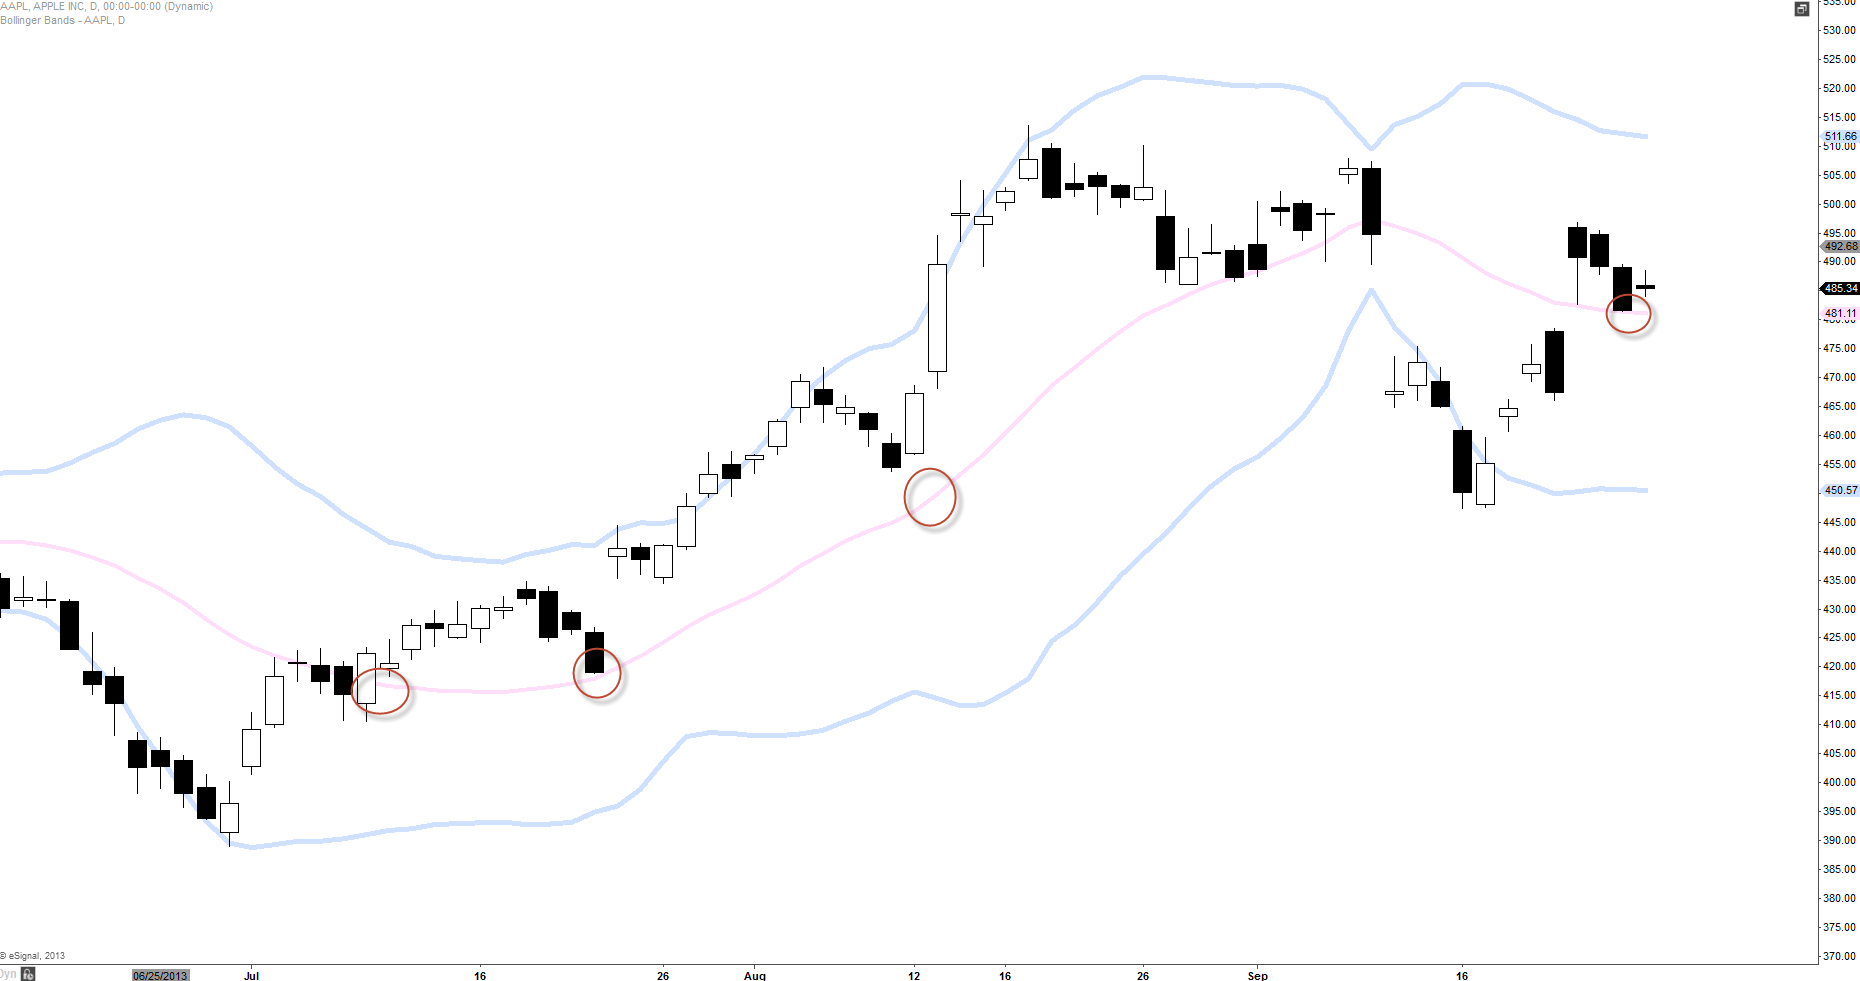
If $AAPL can manage to stay above the middle line and bounce from this level, I do believe that we may see the trend continue to the upside and puncture the upper band in the near future.
[divider]
Fib Expansion Target $550
[divider]
*Chart screened and analysis added on 10/13/13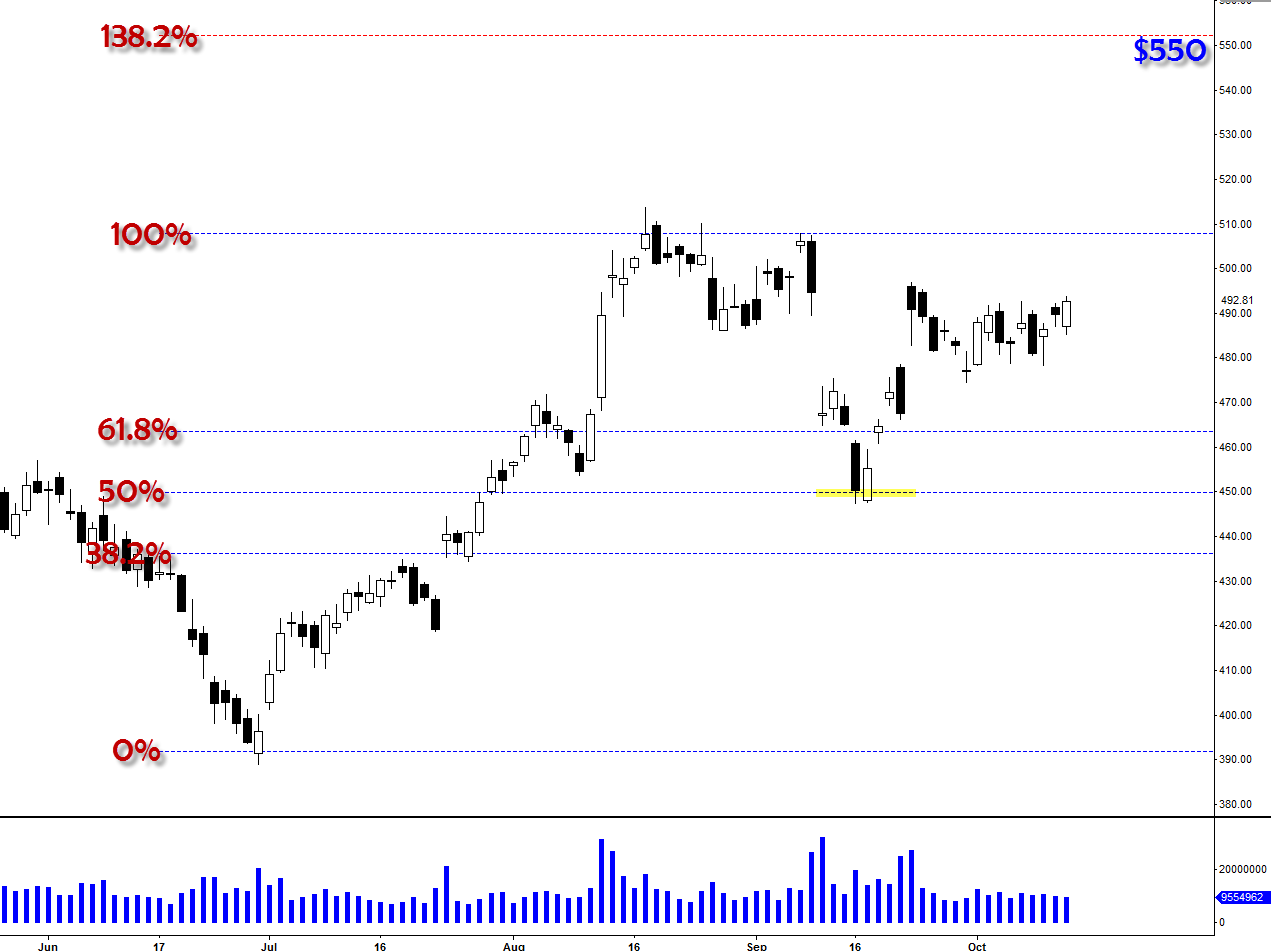
Fib. Expansion level also suggests that $550 being possible major resistance level if we can break above $510. Again this is not a “holy grail” price point where it’s 100% guaranteed that it’s going to get there but as we can see on this article and the analysis I have done, this is the level ($550) that continues to come up and coinciding with multiple analysis. When that happens, that’s when I pay attention as the chart is trying to tell us something.
[divider]
Bullish Continuation Pattern
[divider]
*Chart screened and analysis added on 10/13/13(Weekly Chart)
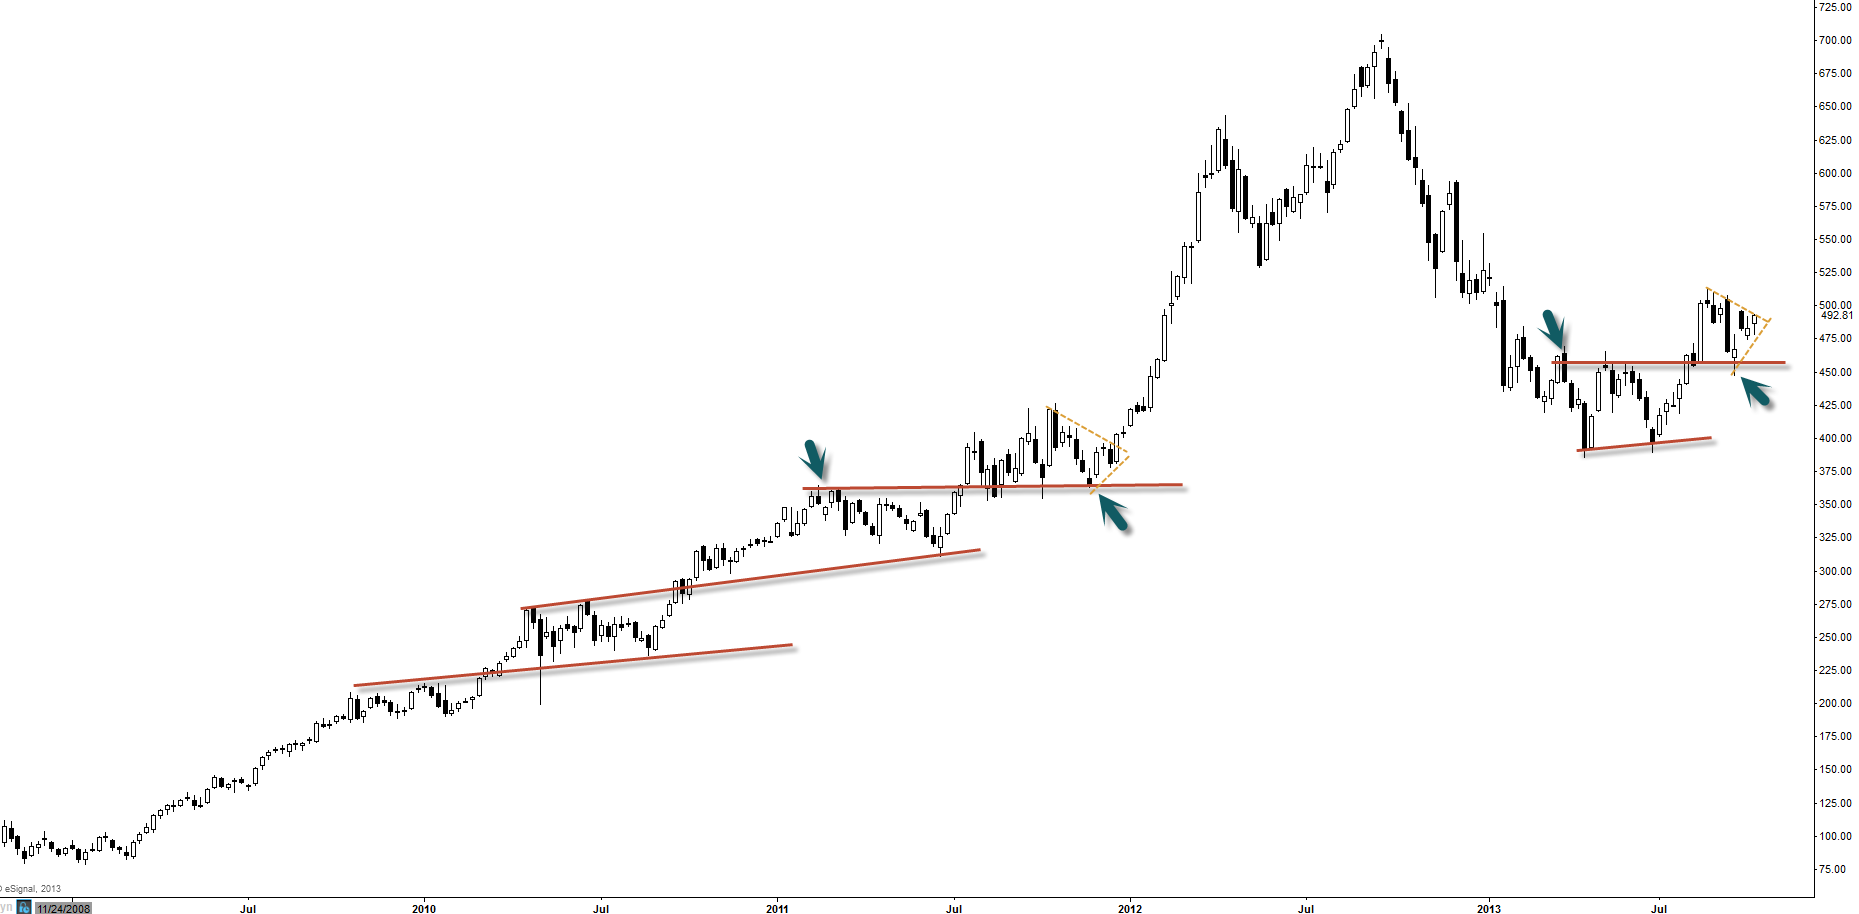
If we breakout of this recent triangle pattern, I see some big moves to the upside with potential target of $550 and beyond.