

[divider]
Related Article(s)
9.8.13 “$AAPL Levels I Am Watching“
[divider]
9.14.13 Saturday
[divider]
Daily 50EMA
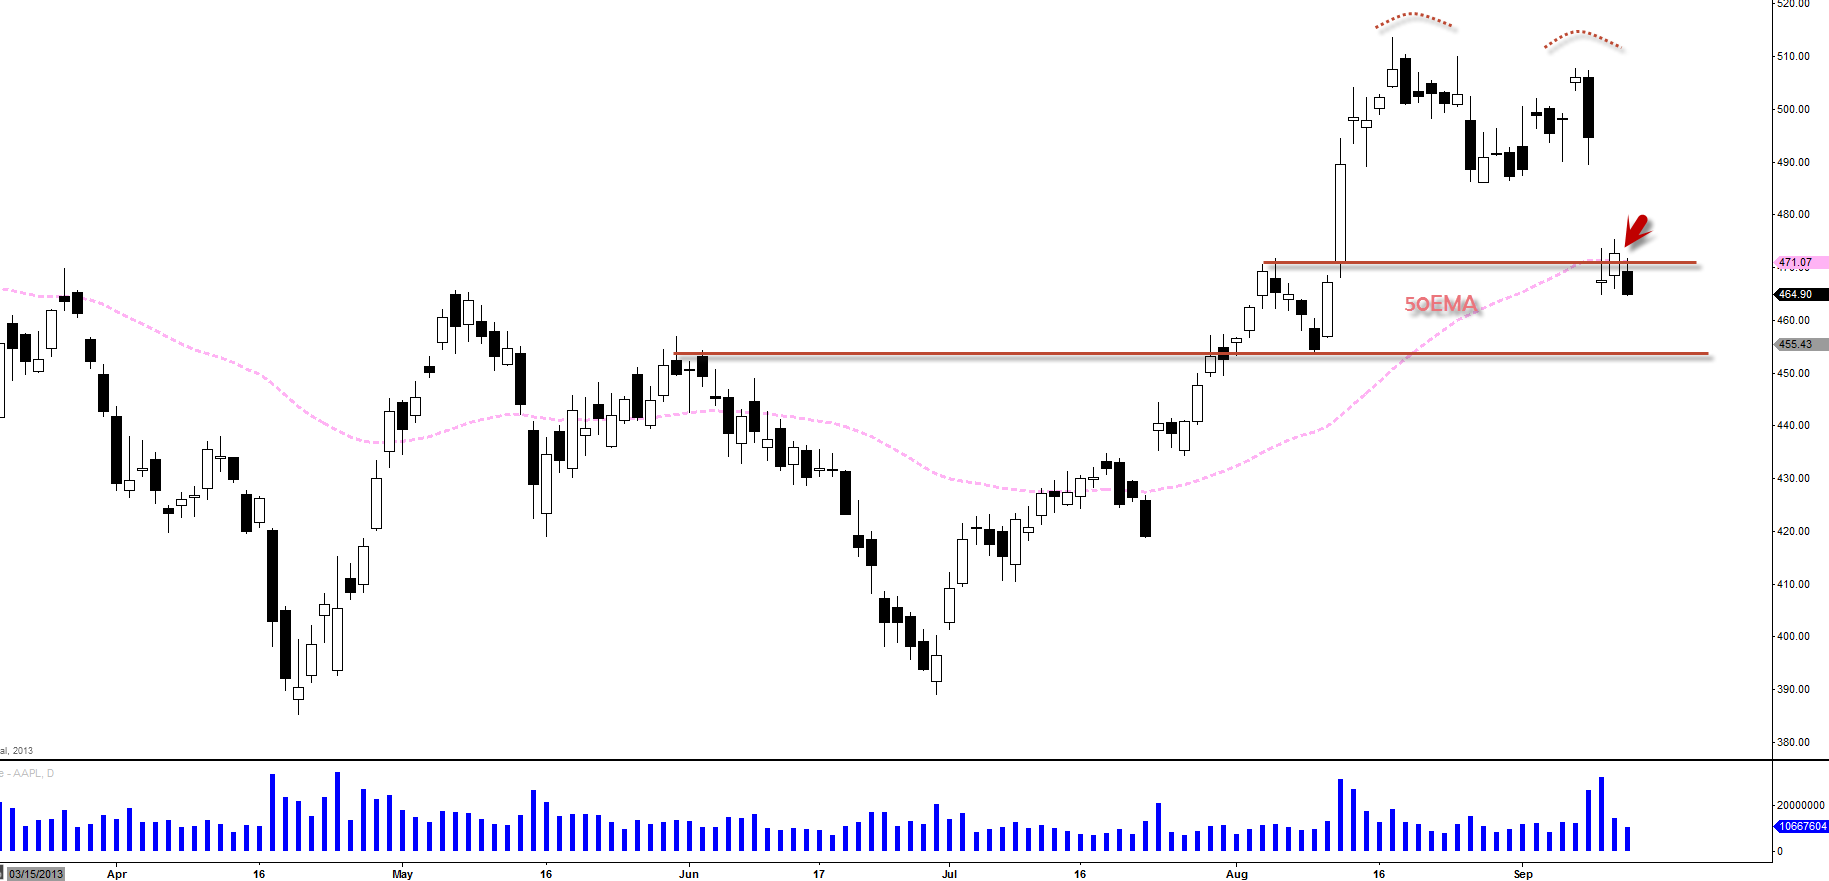
After forming that double top formation, it gaped down big and trying to reclaim that 50EMA for about three days and failed last Friday. It looks like it wants to come down to the next support which is at around $454.50ish which is very important level I am going to discuss further in this post.
I won’t be initiating any long positions as long as this 50EMA continue to act as resistance. First sign of going long would be that $AAPL reclaim and close above this 50EMA but without that, I do think lower prices are in stored.
$450-$454 level is going to the pivotal level to watch and let me explain why I came to that conclusion.
Weekly 20EMA
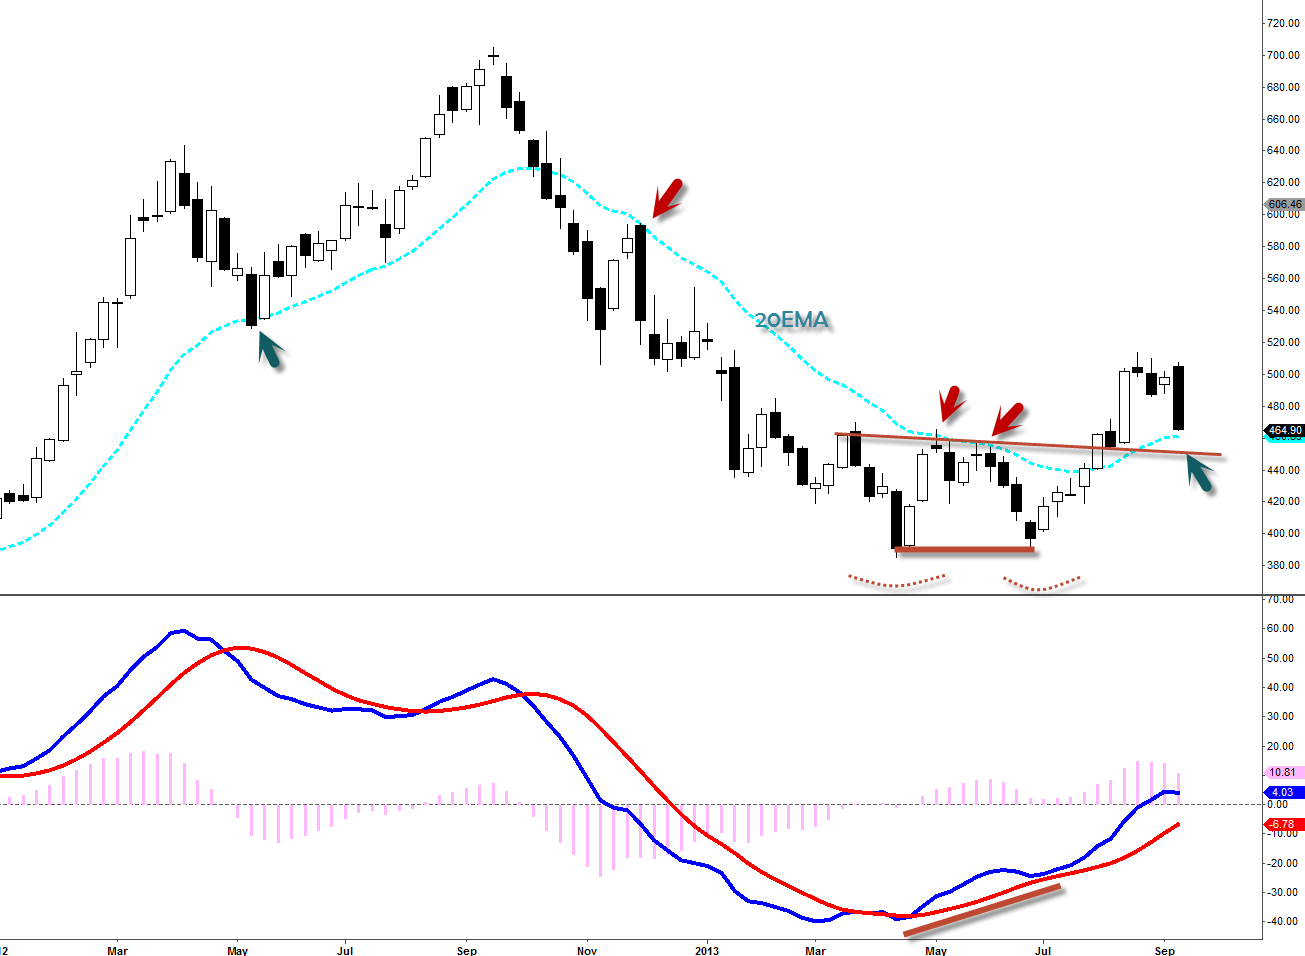
Looking at this weekly MACD, still looking bullish as of end of this week however, we are getting close to turning this thing into a bearish chart pattern. First take a look your weekly 20EMA. As you can see it has been served as pivotal level for $AAPL for quiet sometime now (see arrows). 20EMA and this double bottom neckline ($450ish) is virtually moving together here. Bulls must protect weekly 20EMA level and make sure bears do not reclaim this level if they want this double bottom to sustain it’s control. With MACD bullish divergence confirmed and formed along with weekly double bottom, it still a strong bullish signal and the neckline testing is not that of a surprise for me.
So you could say that we are in the double bottom neckline testing phase. Again that neckline is about $450-454ish on this weekly chart which that coinciding with 20EMA (give or take). Bulls protect this level, I do believe higher prices we will see and this is the level I am watching to possibly go long.
Daily 100SMA
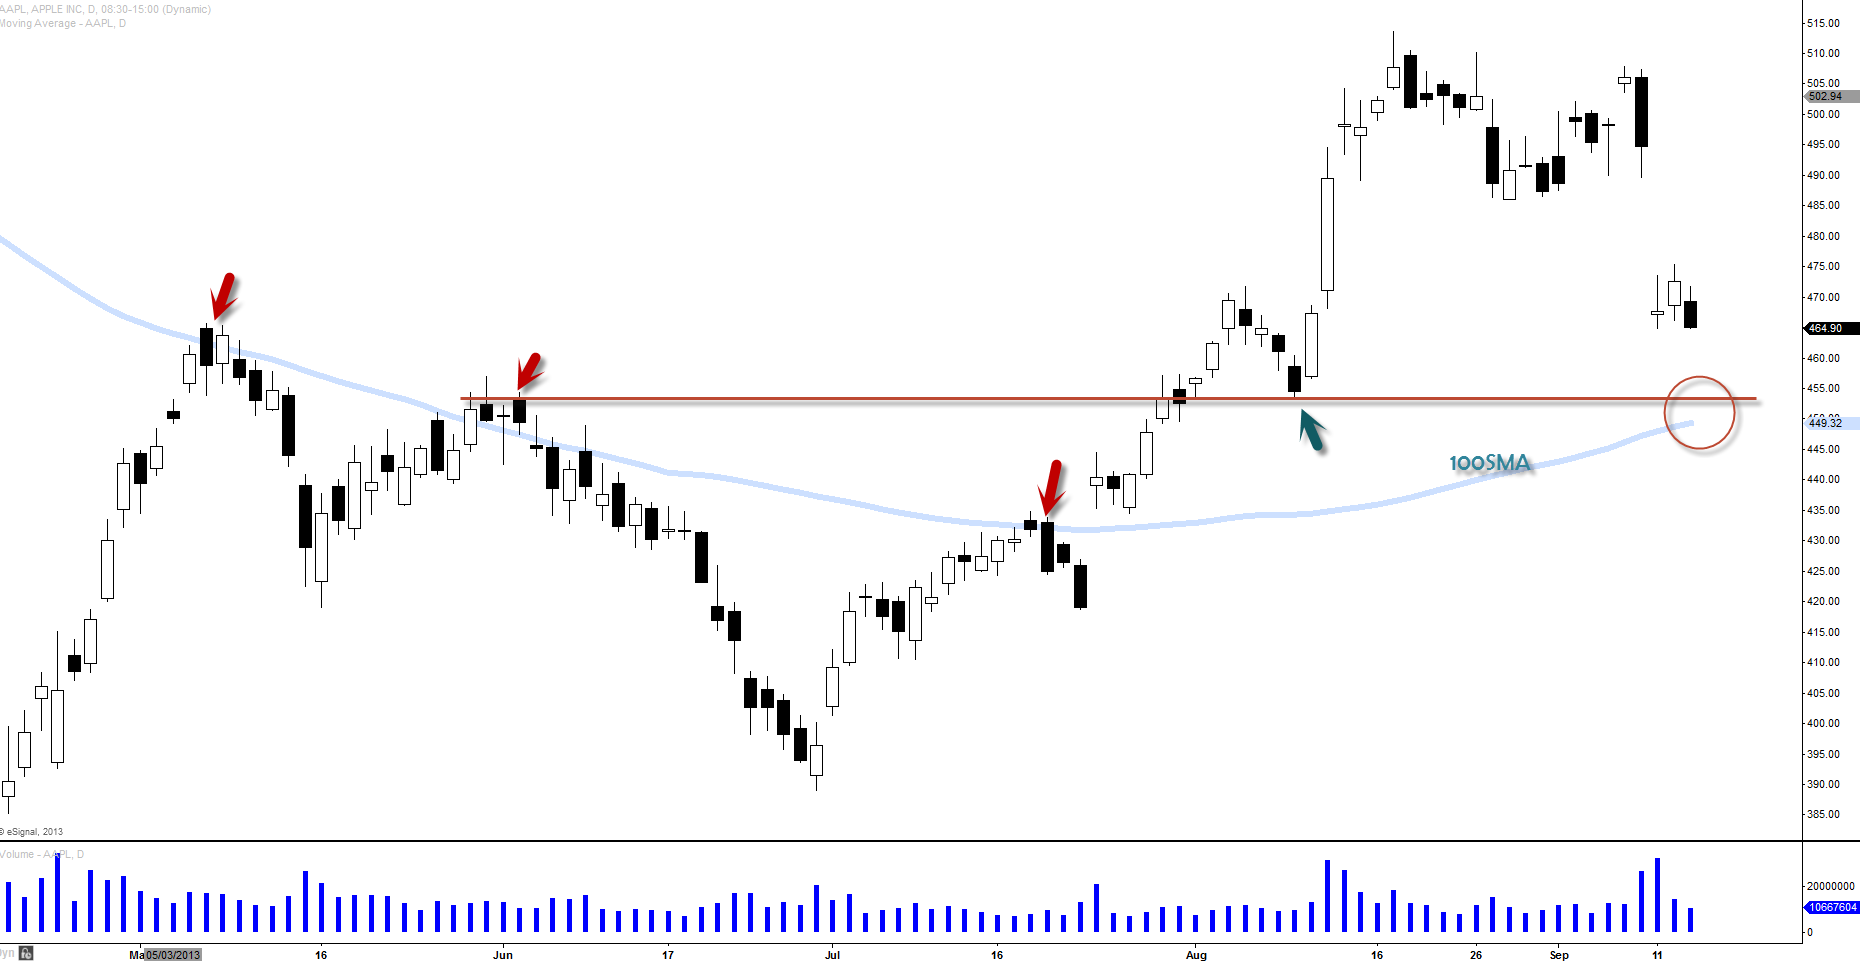
So we talked about 20EMA on the weekly chart that coincides with the weekly double bottom neckline. Well here you can see that 100SMA is the level that is coinciding now with weekly 20EMA (and double bottom neckline on the weekly chart) and the next support level. And all these levels are colliding in the price point of $450-$454ish. So this is going to be very important level for the bulls to hold and protect.
When you see these levels coinciding like this, that’s when you pay attention as the chart is trying to tell us that this is going to be acting as very important level (what I would like to call, “make or break level”).
Fib. 50% Retracement
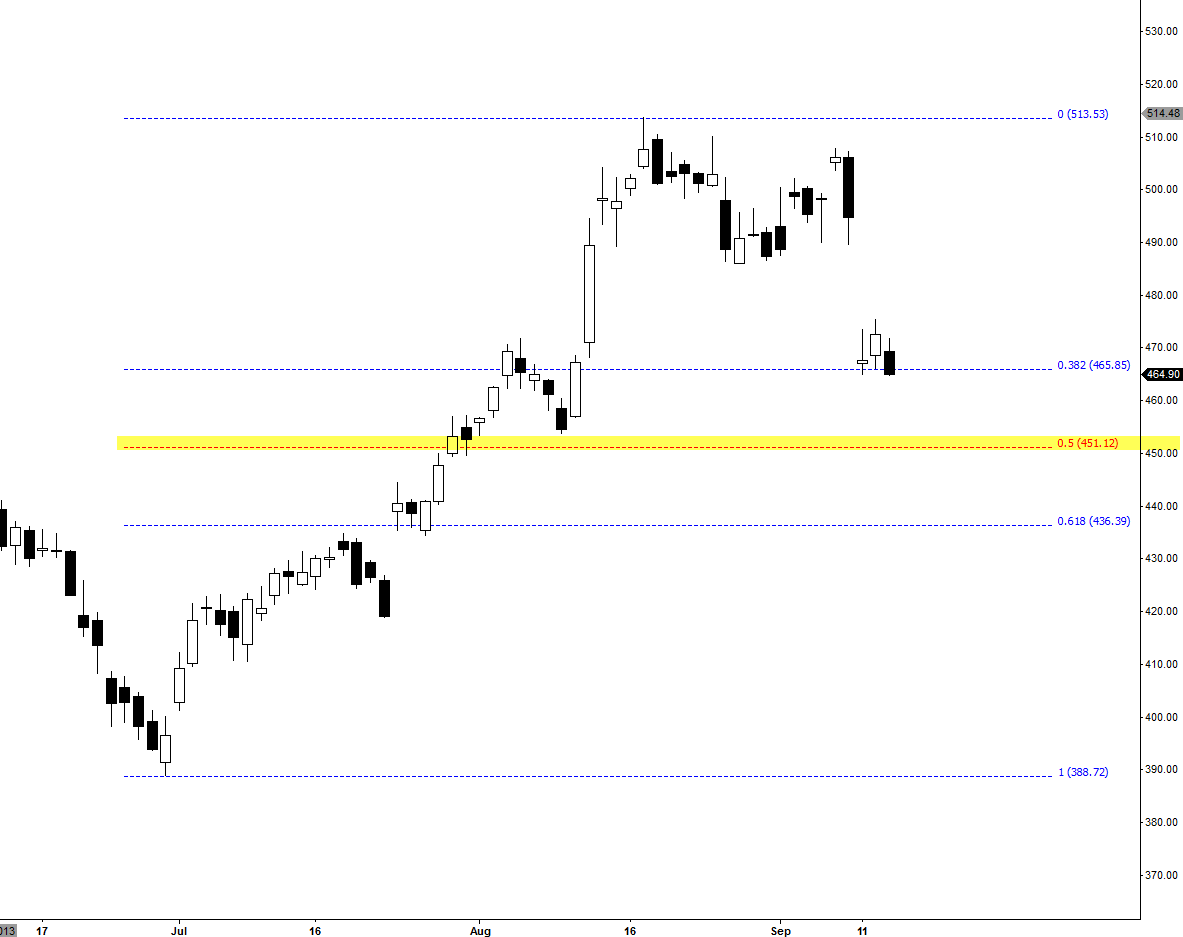
We’ve been talking about $450-$454 level being very important level and guess who showed up on that 50% retracement level. $451ish.
So now we also have 50% Fib is on board on that price level. So this week, I will be watching very closely this price level and I want to see a confirmation of a bounce before initiating long positions but I won’t be hasty at all because with that double top reversal fueled by the gap down is definitely a momentum changer.
What I like to see if that it stays and holds above $450-$454 for about a week or so possibly consolidating before thrusting higher. But in the event that we breach below and close below $450 level, I do think that’s when the danger start to come and army of sellers might show up.
Again $450-$454 is the level to hold and that’s the level I will be watching very closely.