
Last Update: 8.12.13
8/6/2013
[Morning] Entered Calls @ $52.71
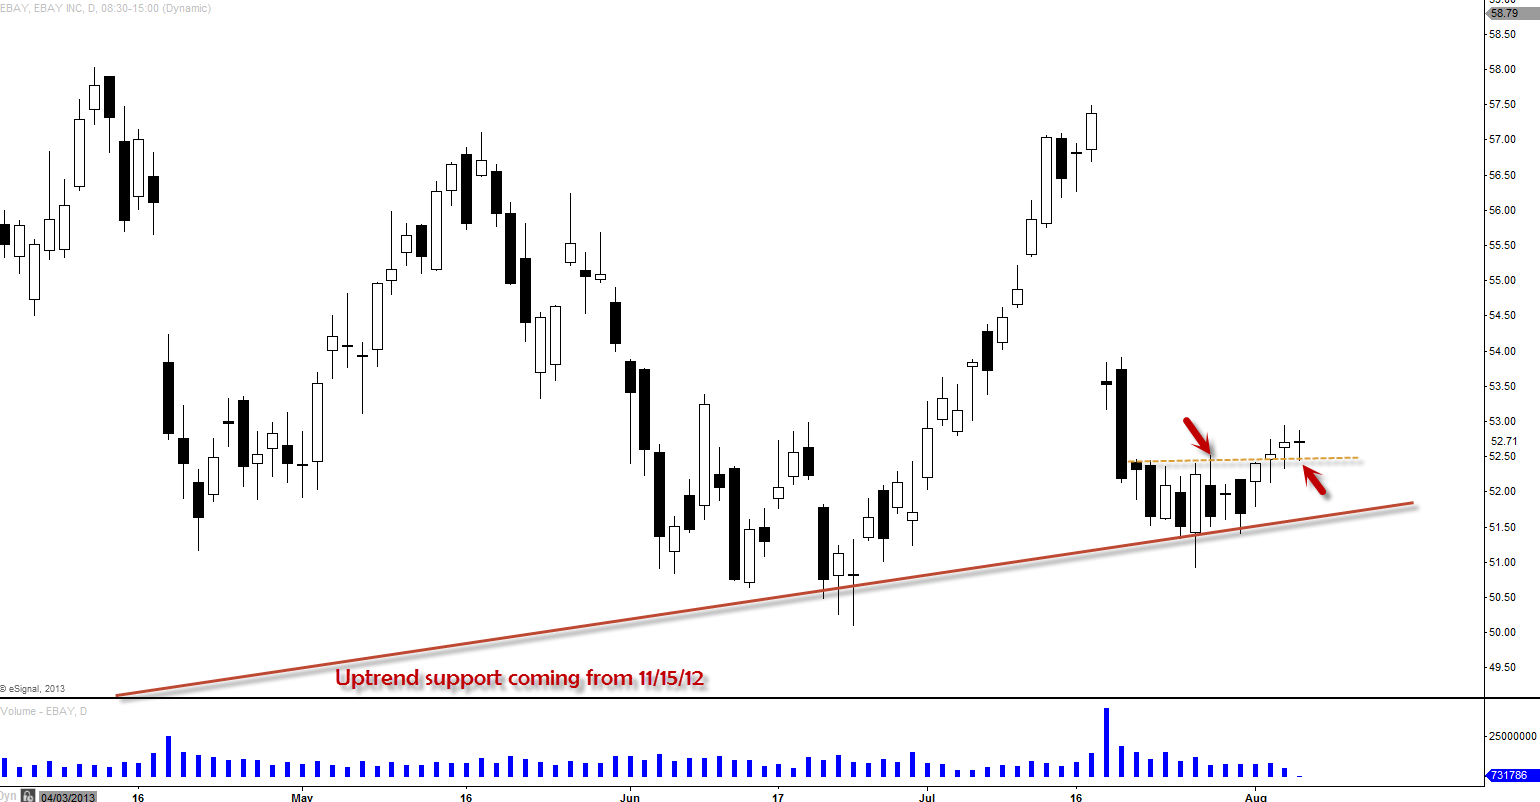
Found uptrend support and last two days, it held up above old resistance that could possibly become new support so I decided to enter calls this morning. Also if you take a look at your oscillators, you can find that it was giving some early signals of reversal at this level here.
[After Close] Bottoms Up

Got volume and we thrust big despite of the weak market condition today. My target is about $57 to fill that entire gap above.
8/7/2013
Holding Full Positions
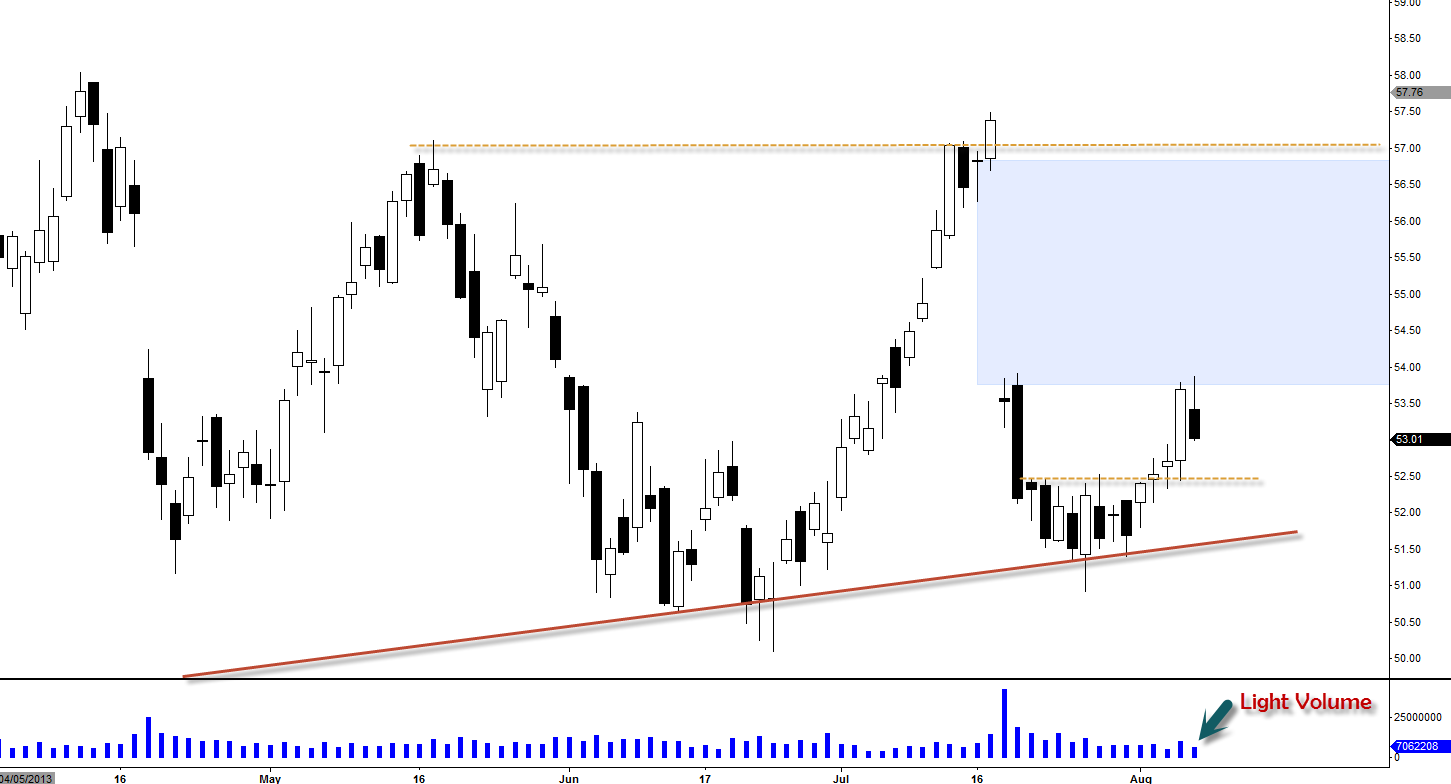
We did come down pretty hard today but with light selling volume. I have to say that the broad market condition took big part of what happened to $EBAY today. So if market can stabilize a bit tomorrow, I think we can see $EBAY climbing higher, if not, we could see further downside. I will stay bullish as long as it stays above $52.40ish level.
8/8/2013
Bullish Continuation Pattern
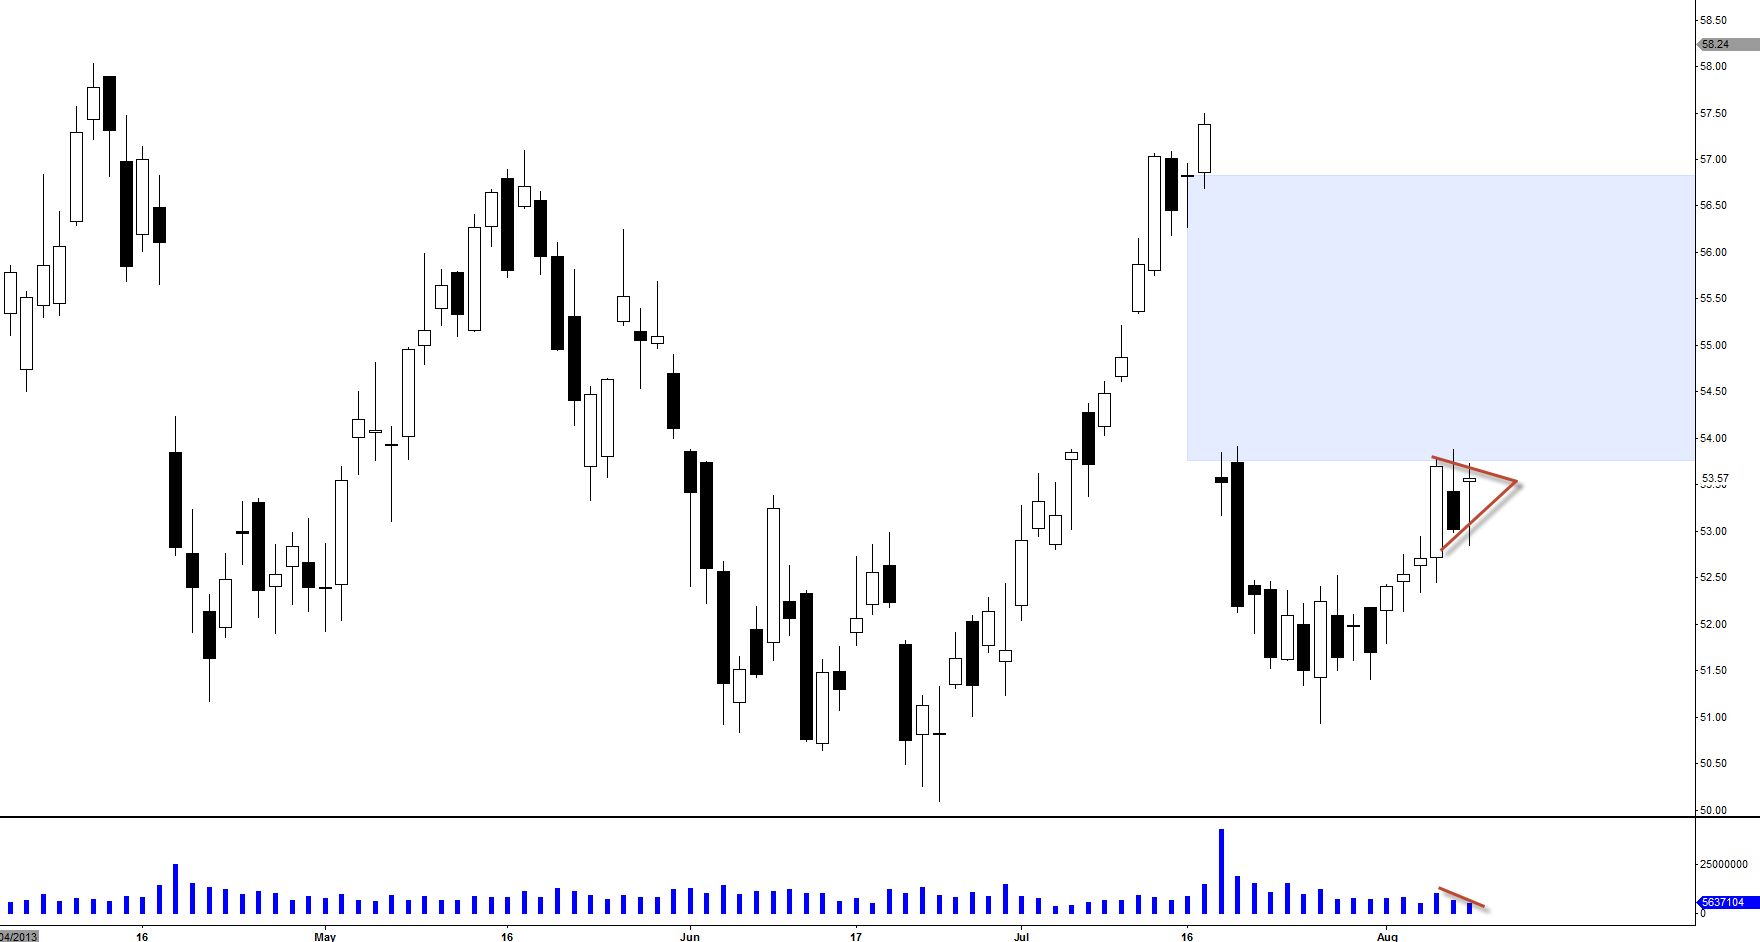
It looks more like bull pennant (bullish continuation pattern) last two days here. As you can see volume has been declining which suggests the selling pressure is dying and it’s holding up well so far. If $EBAY breakouts of this pennant pattern, we should see some volume spike to confirm this uptrend. I am still holding my full positions and just waiting to see if we can have breakout either tomorrow or Monday. Probably not such a good sign if it stays here too long.
8/12/2013
[At Open] Got Stopped Out with Loss @ 52.78
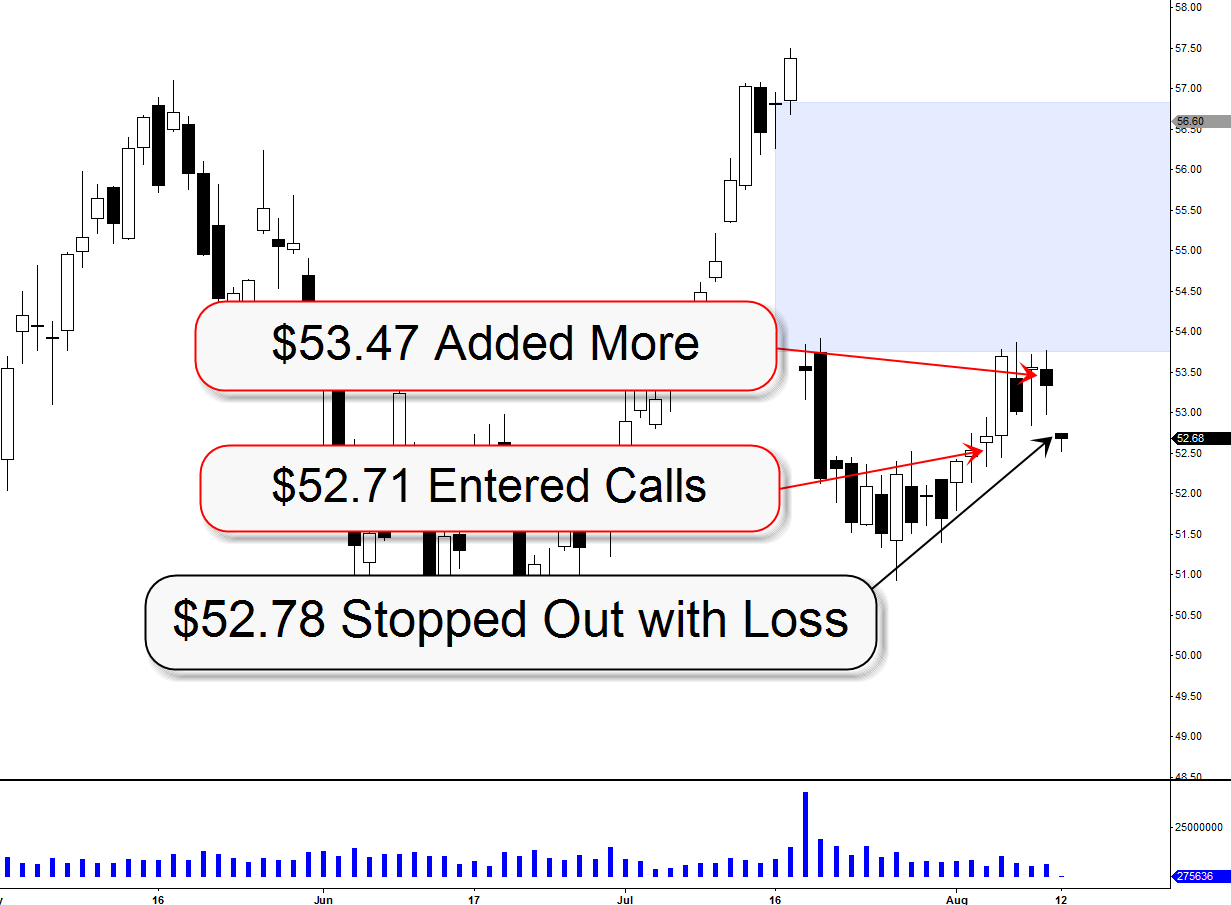
Above chart was screened this morning at open but looking at the chart after close, it still looks bullish. I want to make sure it closes above 100SMA first before initiating long positions. I might get back in if or when that happens as the chart still looking bullish as of today.