[divider]
Last Update: 3.11.13
[divider]
Related Articles
Article from 9/28/12 – “10 Reasons of Why I am Extremely Bearish on $AAPL”
Article from 12/15/12 – “Why I Believe $AAPL is Headed $360”
Article from 1/1/13 – “Short-term Bullish Trade Idea Gone Rogue $AAPL”
Recent (2/13/13) video analysis where I spend little bit more time on $AAPL
[divider]
2.12.13 Tuesday
[divider]
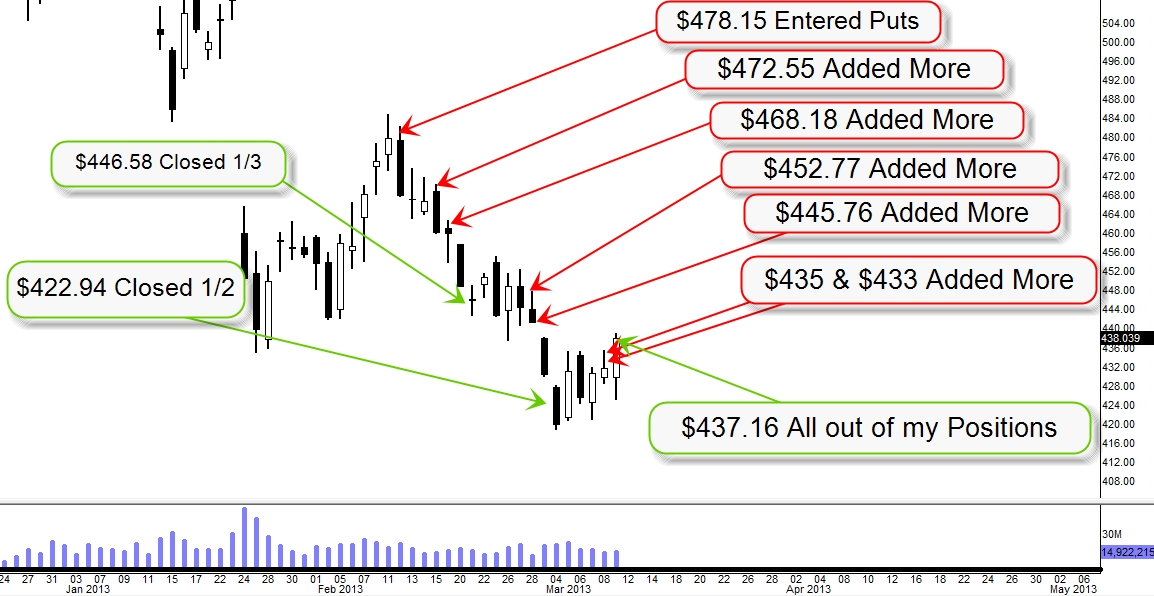
8:45AM CT: Entered Bearish @ $478.59
(Daily Chart)
Just little bit after open, I entered bearish at around $478.59 because I have reasons to believe that bearishness would roll back into this stock. Let’s break it down.
[divider]
Acumen 1 | Long-term Uptrend Now Resistance @ $480
(Weekly Chart)
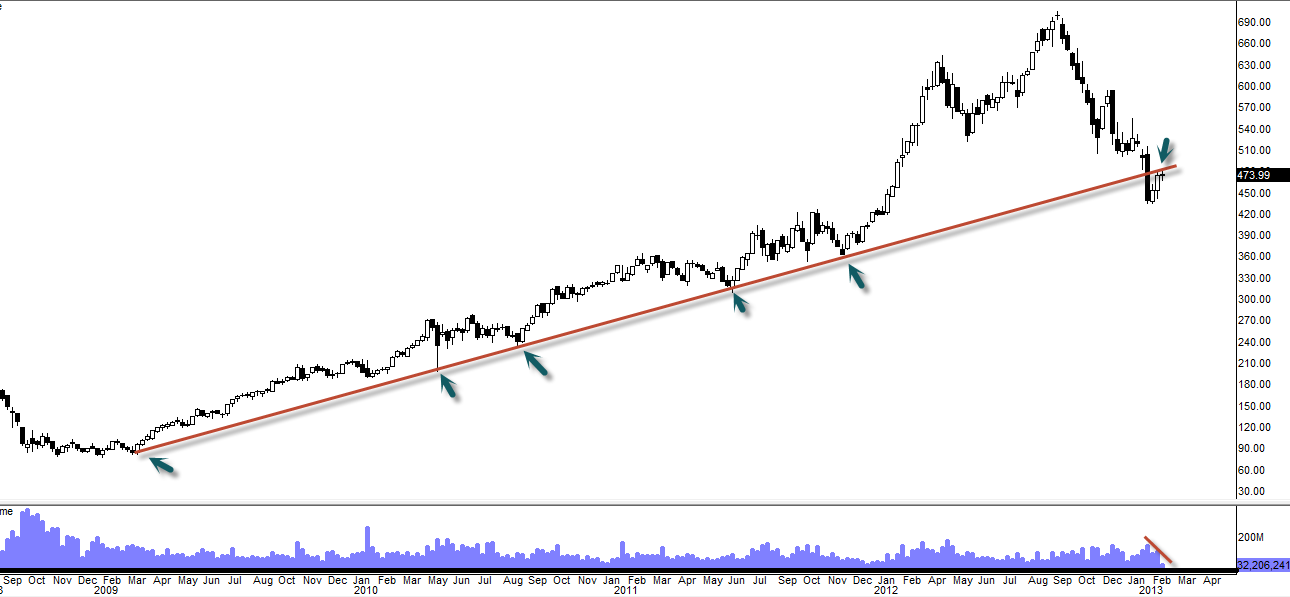
One of the key fact of my decision was that ‘old support becomes new resistance’ theory. As you can see on this weekly chart that this 4 years of worth uptrend support has been broken early January and stock is now retesting that level. If you flip this chart to daily, you will soon realize that $480 is where it’s hitting as resistance today. Also looking at this weekly chart, it might be forming a bear flag though it is still early to tell.
Acumen 2 | Long-term Downtrend Resistance @ $480
(Daily Chart)
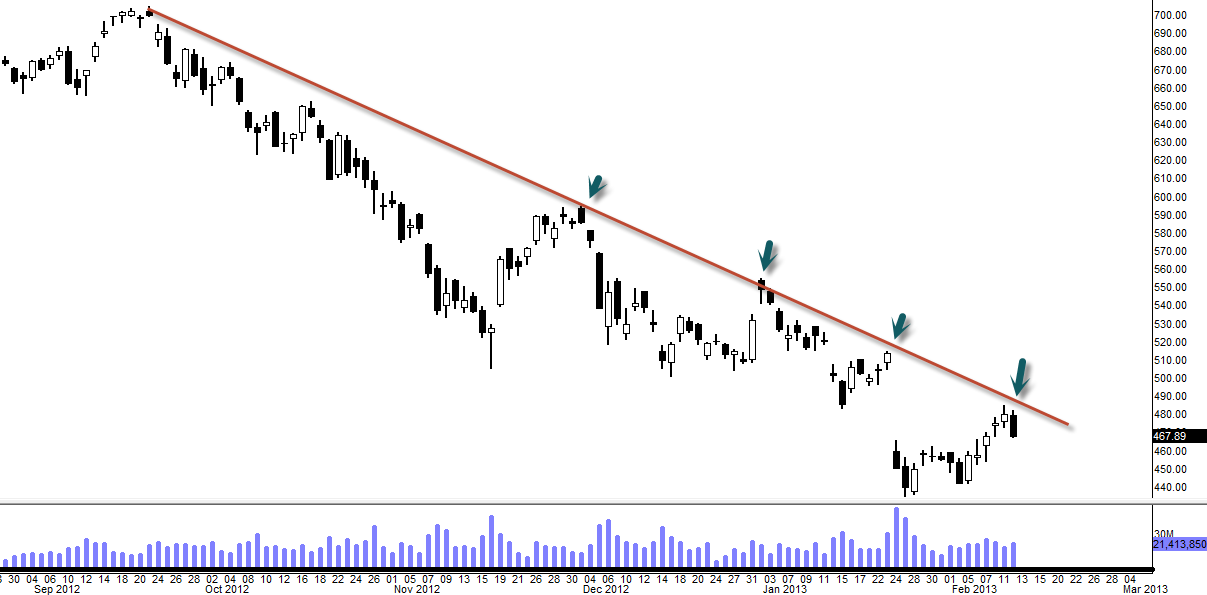
$480 is also another key level because of that long-term downtrend resistance from the September of 2012. It couldn’t even able to touch that long-term downtrend resistance and tanked.
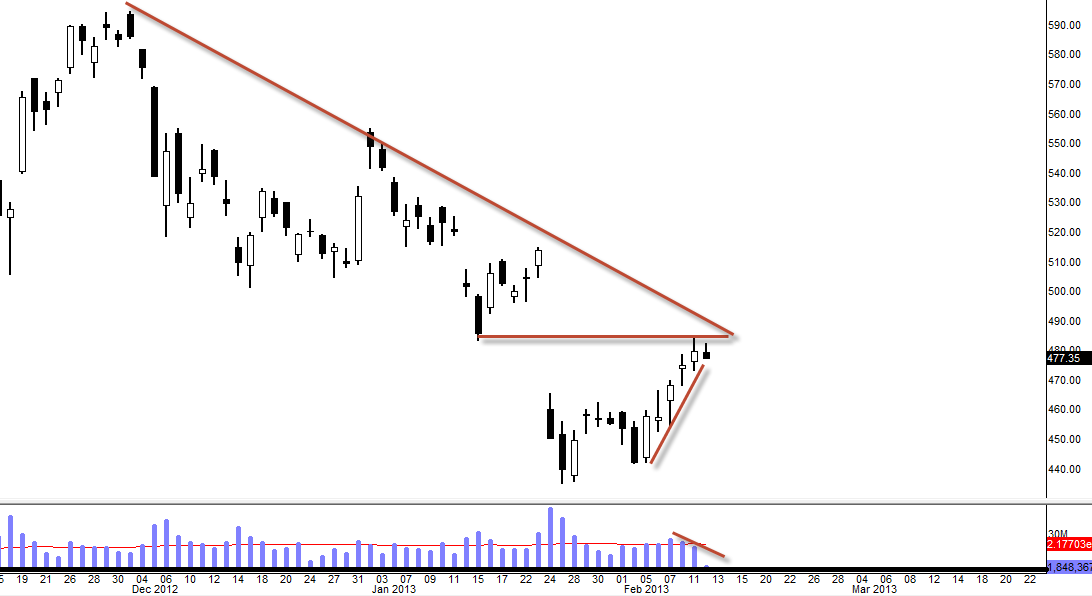
Acumen 3 | Recent Resistance & Volume $480
(Daily Chart)
Again we see that $480 level is the low of 15th of January’s candle which is now acting as resistance and not to mention it is coinciding with long-term downtrend resistance at $480 vicinity. Last three days volume continued to decline while the stock slowly grind to the upside. And even if you look at last three days of candles, you can find that weakness (in candle sentiment) in that recent run. $437 and $425 is my next target and if we break below $425, then my ultimate target of $360 is where its headed.
[divider]
2.13.13 Wednesday
[divider]
Added More Puts @ $472.55
[divider]
2.14.13 Thursday
[divider]
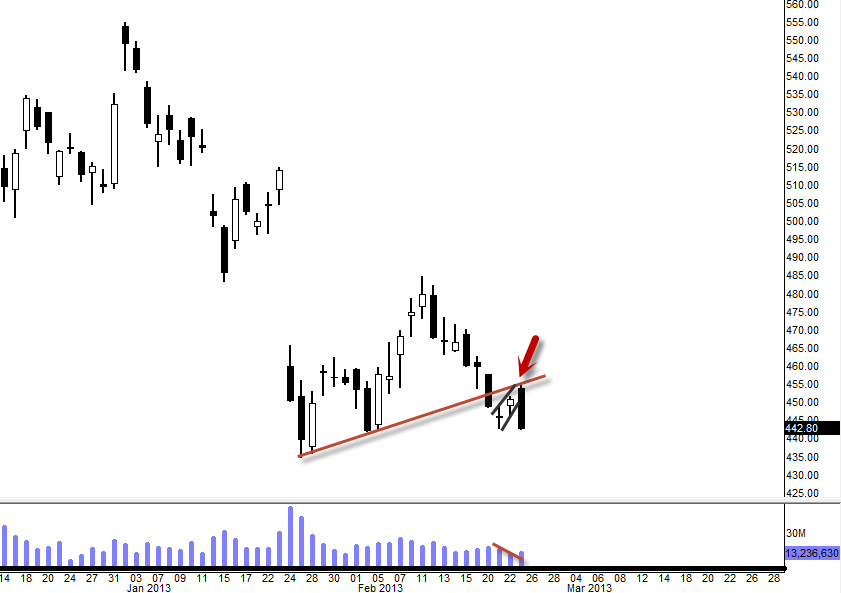
Added More Puts @ $468.18 (65Mins Chart)
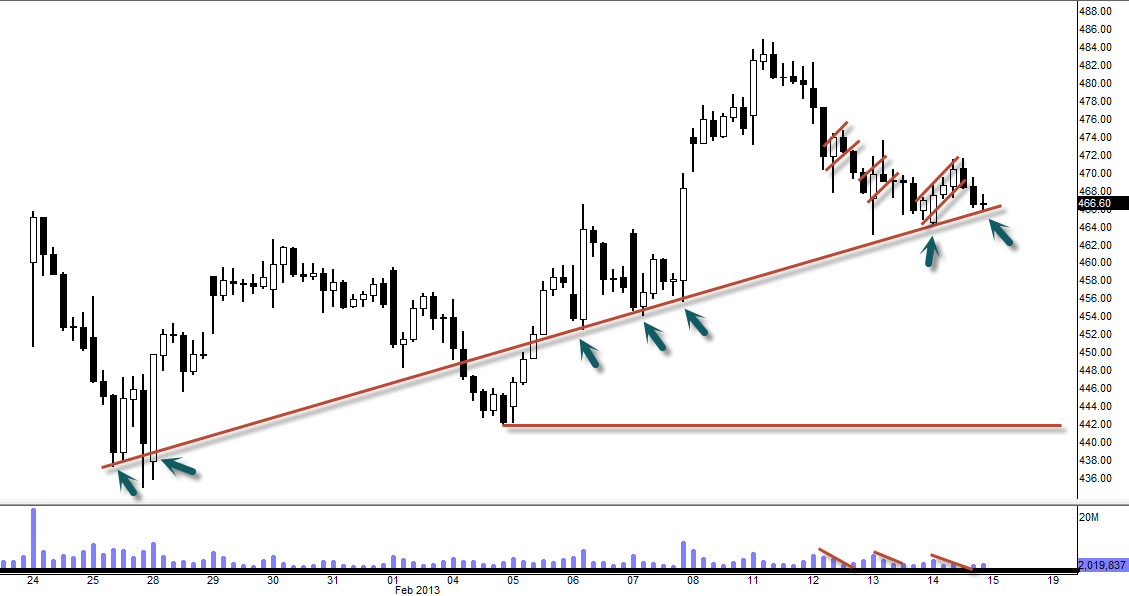
As you can see on this 65mins chart that we are finding some support at this uptrend support line so the day ended with Doji in the middle of bear flagging action. We break below and close below that uptrend support line tomorrow or early next week, $442 is where it’s headed and I believe it’s going to get there fast when it starts to roll.
(Daily Chart)
Looking at this daily chart and 20EMA (green), last two days have been some pressure from the bears when the bulls were not able to stay above 20EMA. Below 20EMA, so far, it has been the Bears territory. Last 90 days, $AAPL managed to stay above 20EMA only about 10 days. That’s alarming because it has been under duress last two day under 20EMA. Last two days candles tell us that story clearly. Currently finding some support at $465ish level but I do believe (since $AAPL is now in bears territory) that if that $465ish support is broken (by closing below that level with some volume), it could roll over back down to $440, $435 and $425.
[divider]
2.15.13 Friday
[divider]
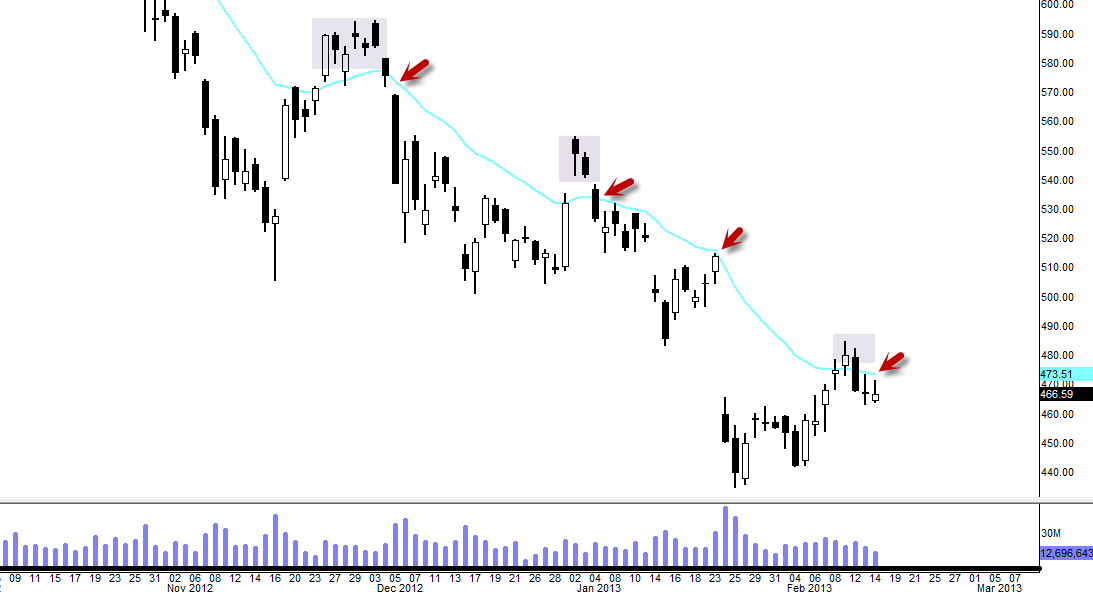
Holding Full Bearish Positions | PACMAN Action

PACMAN Action: Every time when lower wick showed up, it ate it (on daily chart)
We are now entering the bears territory (below 20EMA – see arrows) and it does NOT look good for bulls. As you can see on this daily chart, last three months when $AAPL closes below 20EMA, bears start to attack and run this thing down. Still quiet early to say that the bulls are completely destroyed because if you look at today’s volume, it’s still not enough for bears, however today we did close below recent support of $465ish. And I wouldn’t be surprised if $AAPL try to retest that $465 level on Tuesday intra-day and if $465 level holds as new resistance, it’s going back down to $452 and $435 as next recent supports.
[divider]
2.20.13 Wednesday
[divider]
Tankage Continues…
Volume is increasing thus bears are finding some momentum here. Next support at around $440ish. Still holding full positions.
[divider]
2.21.13 Thursday
[divider]
Closed 1/3 of my Bearish Positions @ $446.58
[divider]
2.25.13 Monday
[divider]
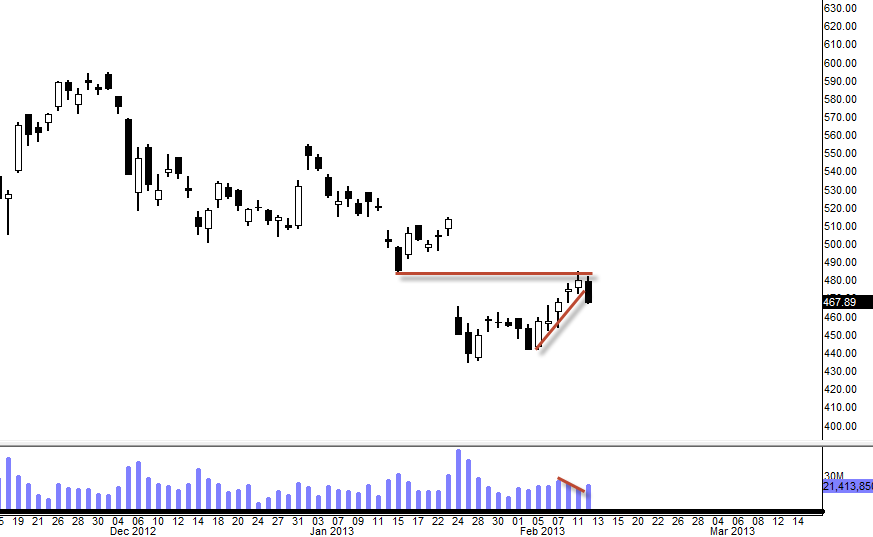
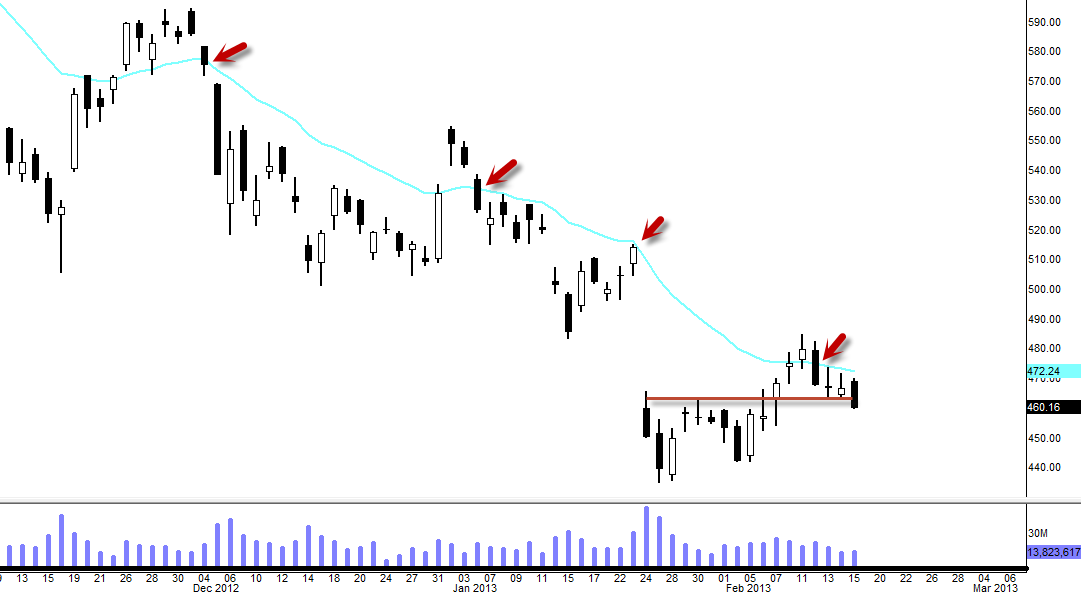
9:35AM CT: Added More Puts @ $452.77
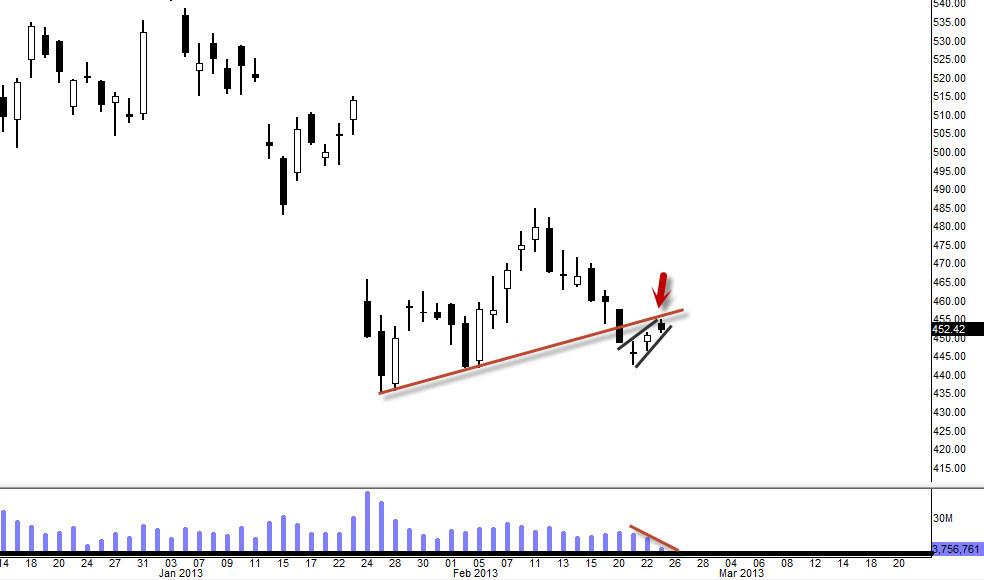
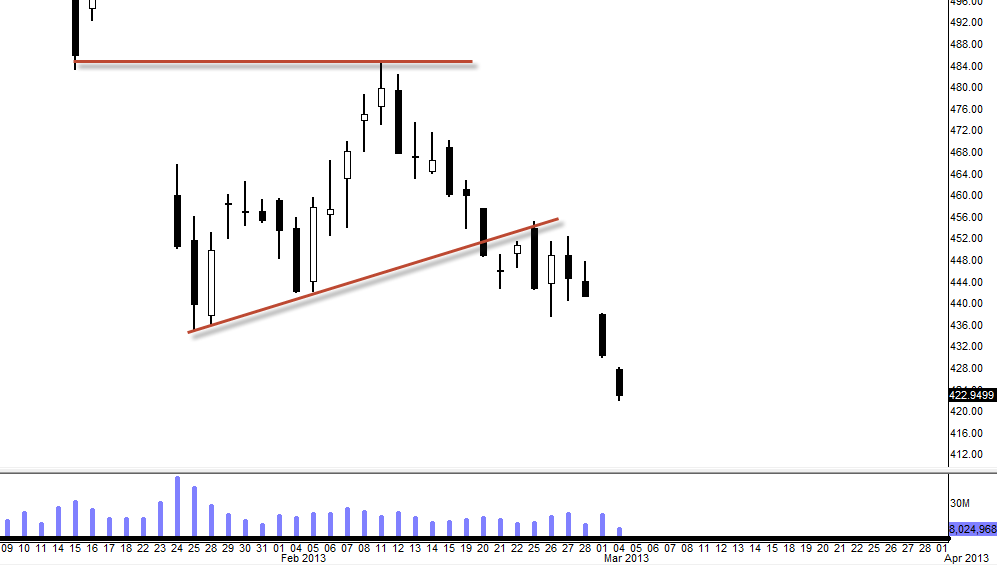
As I was tweeting this exact chart this morning that the recent upside move was not supported by volume thus creating bear flag. Also old support was now becoming a new resistance (see arrow).
After Close: Bear Flagged
Next support at $435, if doesn’t hold, $425 is where its headed to fill that remaining gap.
[divider]
2.27.13 Wednesday
[divider]
12:05PM CT: Added More Puts @ $445.67 (65mins Chart)
[divider]
3.1.13 Friday
[divider]
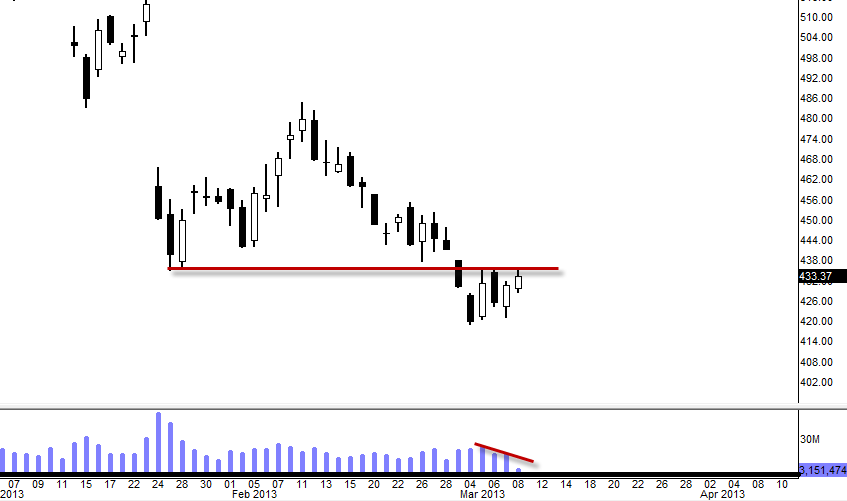
Holding All Current Positions
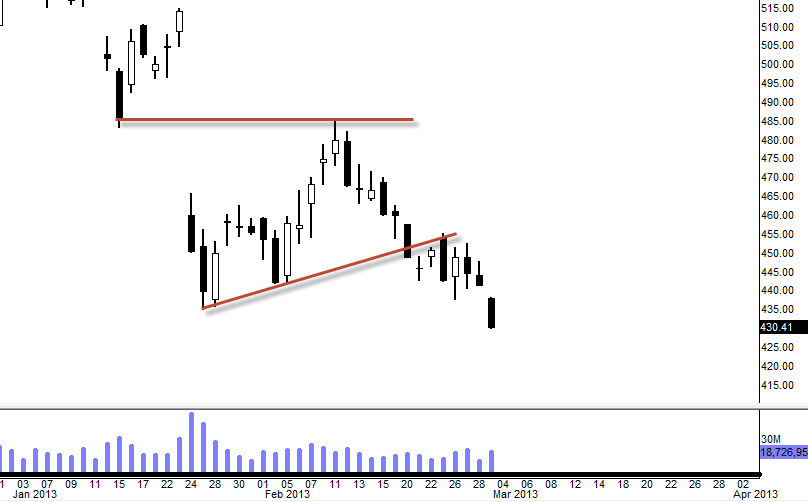
Once it broke major support, that was the end of it. $425 is my next target, however, I wouldn’t be surprised to see $AAPL fizzles around $435 level to test as new resistance next week.
[divider]
3.4.13 Monday
[divider]
Closed 1/2 of my Bearish Positions @ $422.94
We filled the gap at $420 today and tankage is continuing. However I wouldn’t be surprised to see $AAPL retest $435 level as new resistance sometime next few days.
[divider]
3.8.13 Friday
[divider]
Added More Puts @ $435.02 & $433.37
Expecting $420 by EOD today or Monday.
[divider]
3.11.13 Monday
[divider]
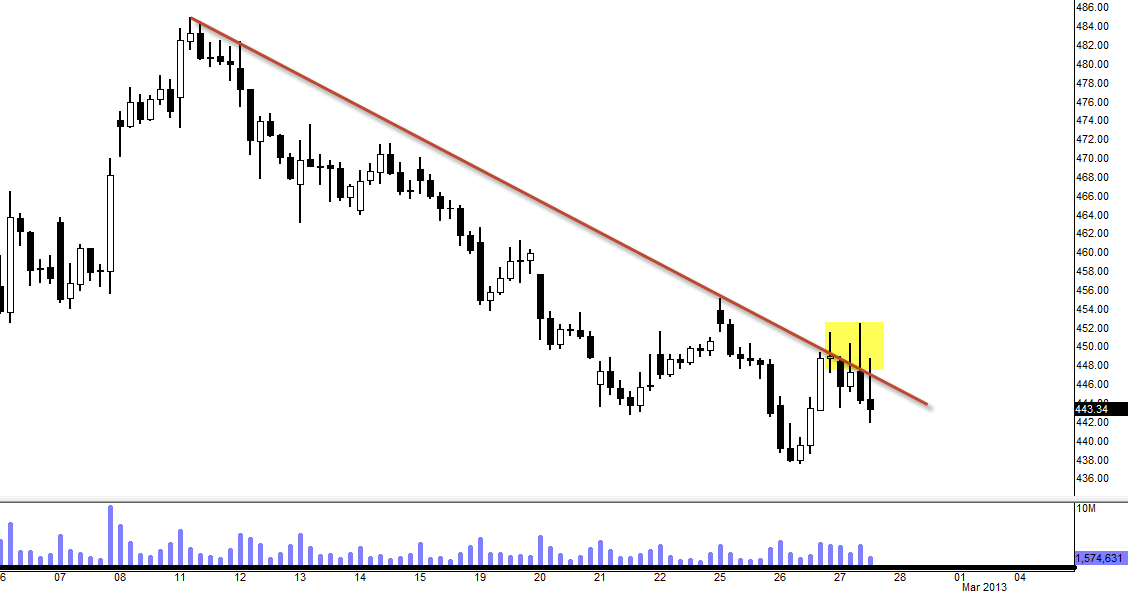
I Am Completely Out of My Puts @ $437.16
Here is the Reason Why (65mins Chart)
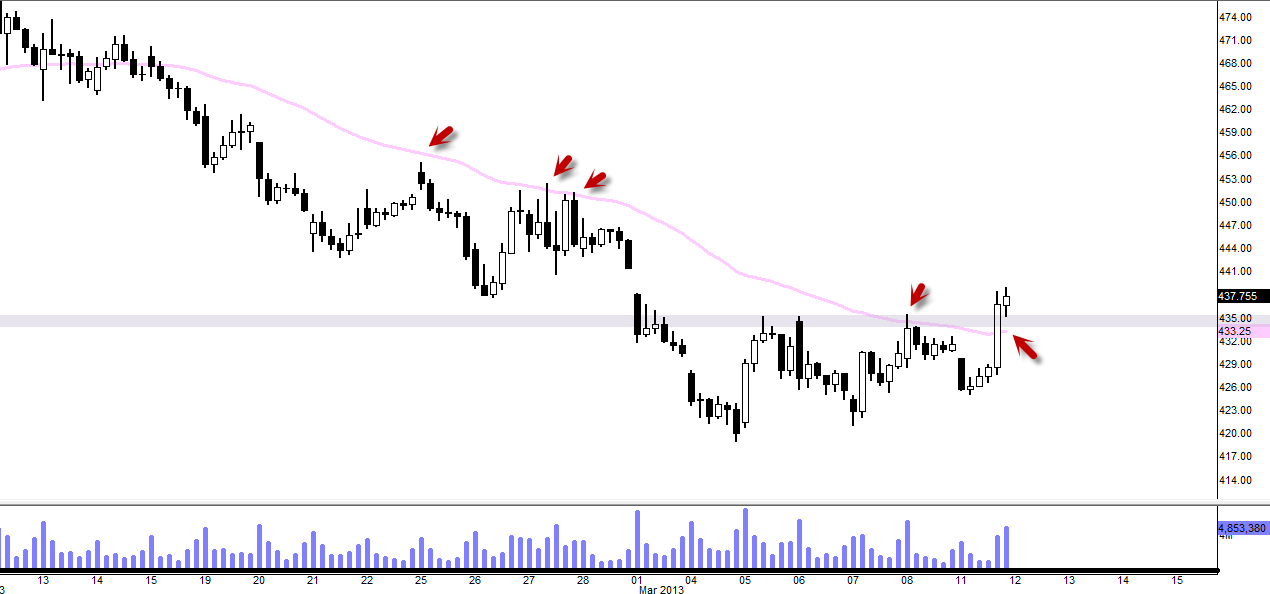
We closed above important horizontal resistance level and above 50EMA (see arrows) with HIGH Volume. I might think about going long tomorrow depending on the intra-day action for a very short-term.

