
Last Update: 4.17.13
3.16.13 – Bearish Divergence (weekly) chart updated
3.16.13 – *Bonus Chart* Weekly bear flag chart added
3.16.13 – Volume Must Confirmed the Trend (monthly) updated
4.17.13 – Monthly Bearish Divergence chart added
[divider]
2.1.13 Friday
[divider]
1. Fibonacci Expansion Resistance (Daily)
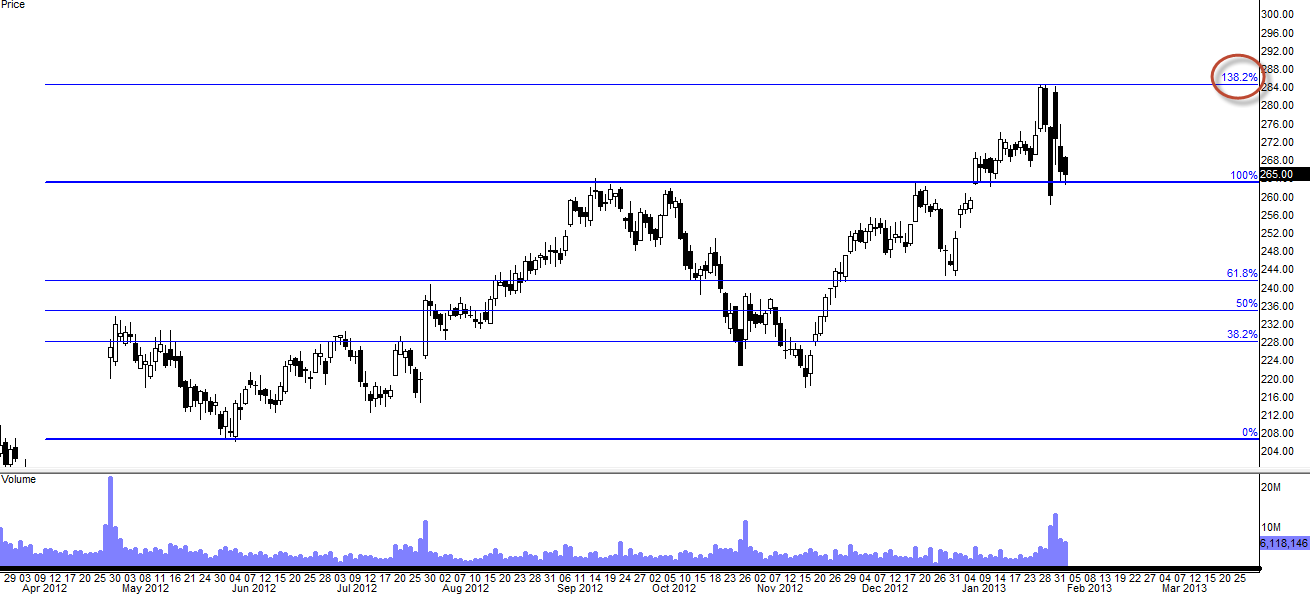
Measured from $208 (6/1/12’s low=0%) to $263.50 (9/14/12’s high=100%) and expansion variable 138.2% at the top of the recent move of $285.
2. Double Top Reversal (Daily)
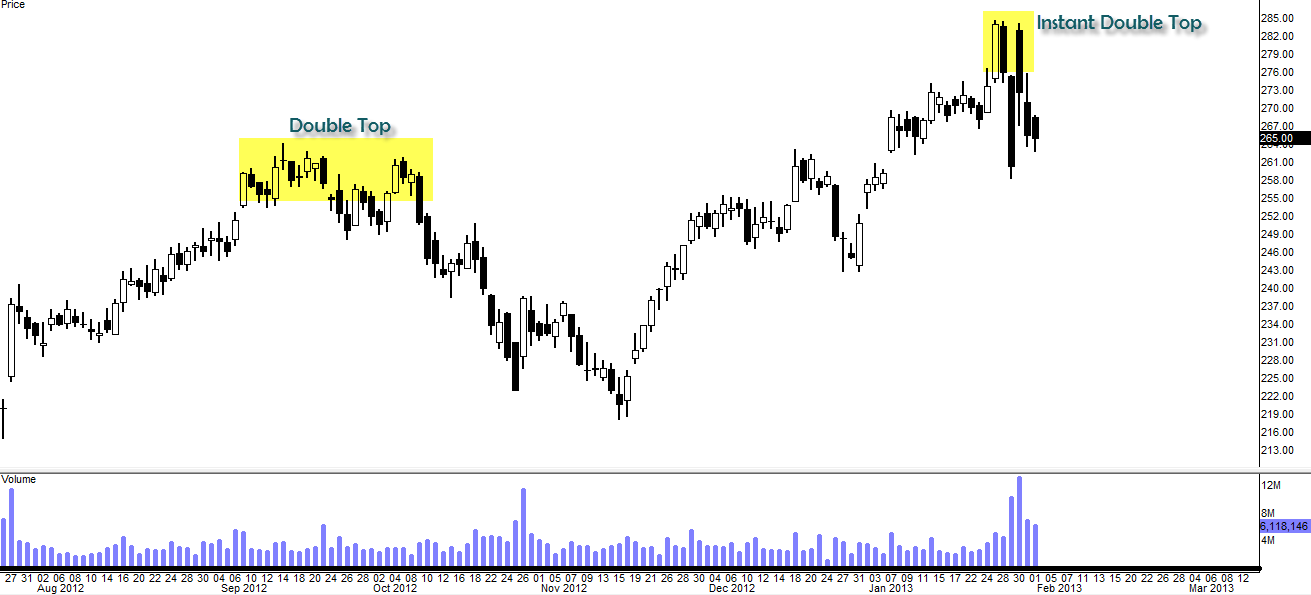
What we have currently isn’t a textbook Double Top reversal however the effect could be similar as it hit the ceiling twice and failed miserably. I called this one, “Instant Double Top”.
3. Bearish Divergence (Daily)
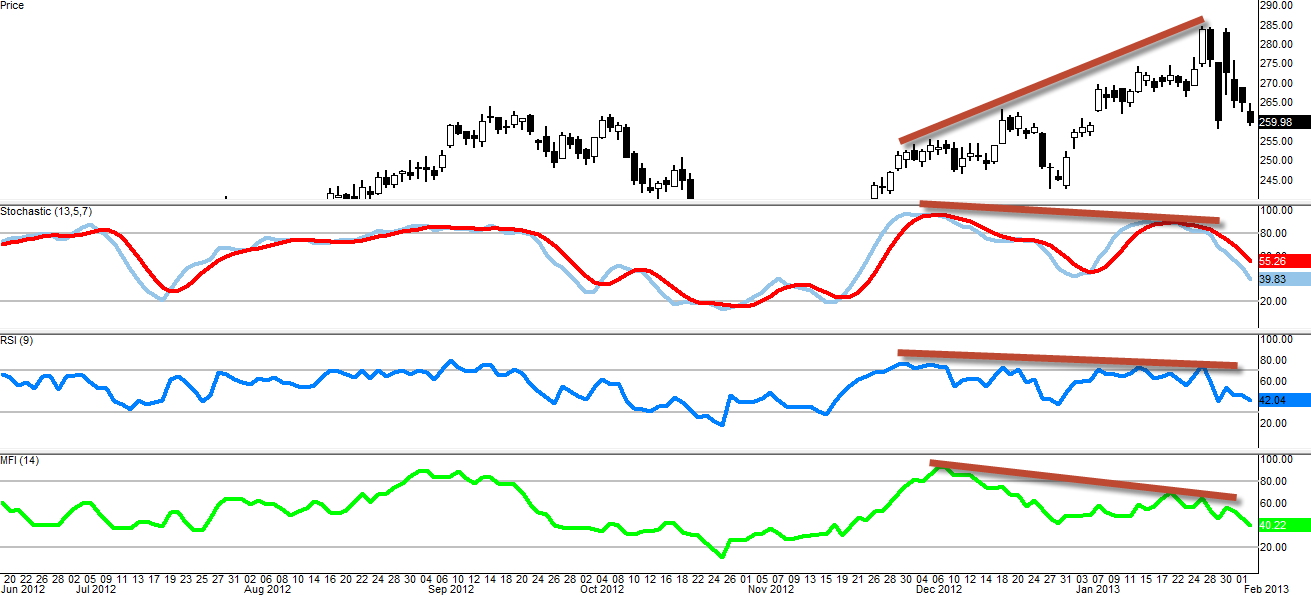
We have confirmed bearish divergence on the oscillators (Stoch, RSI, MFI). *They are not clean Peak to Peak divergence but the sentiment of the divergence is there.
4. Bearish Divergence (Weekly)
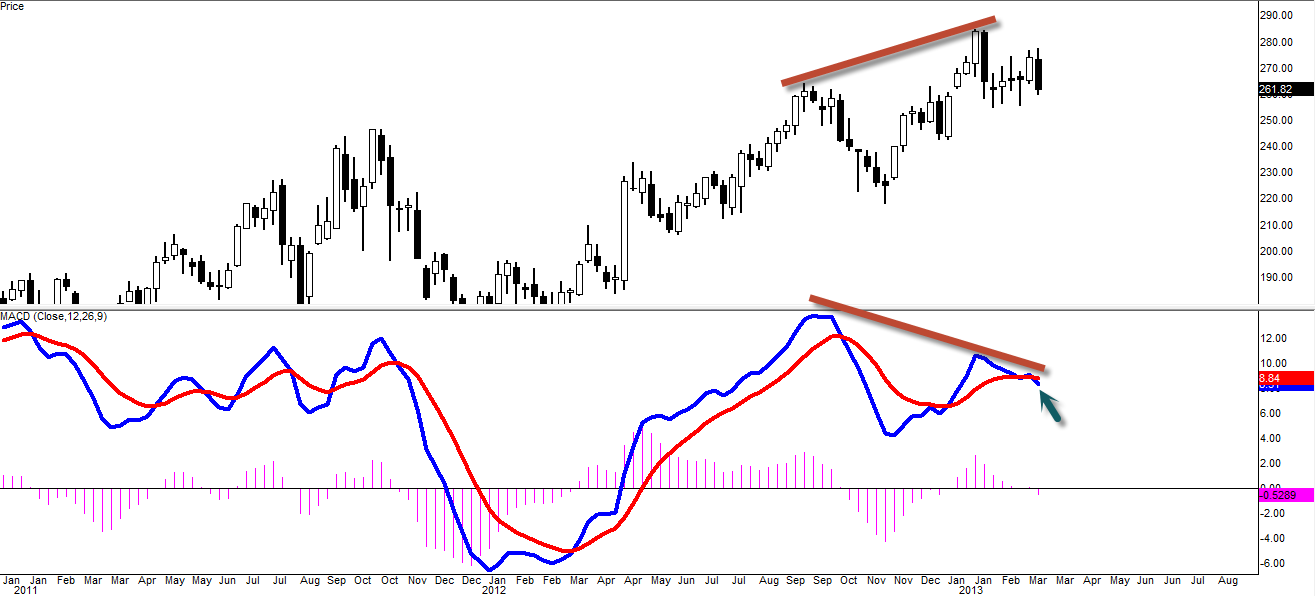
(Weekly MACD – updated 3.16.13)
This is a CLEAN and PERFECT MACD Divergence with PEAK TO PEAK divergence in formation. This type of divergence carries so much higher potency (compare to divergence with many peaks) when it comes to divergence that actually plays out.
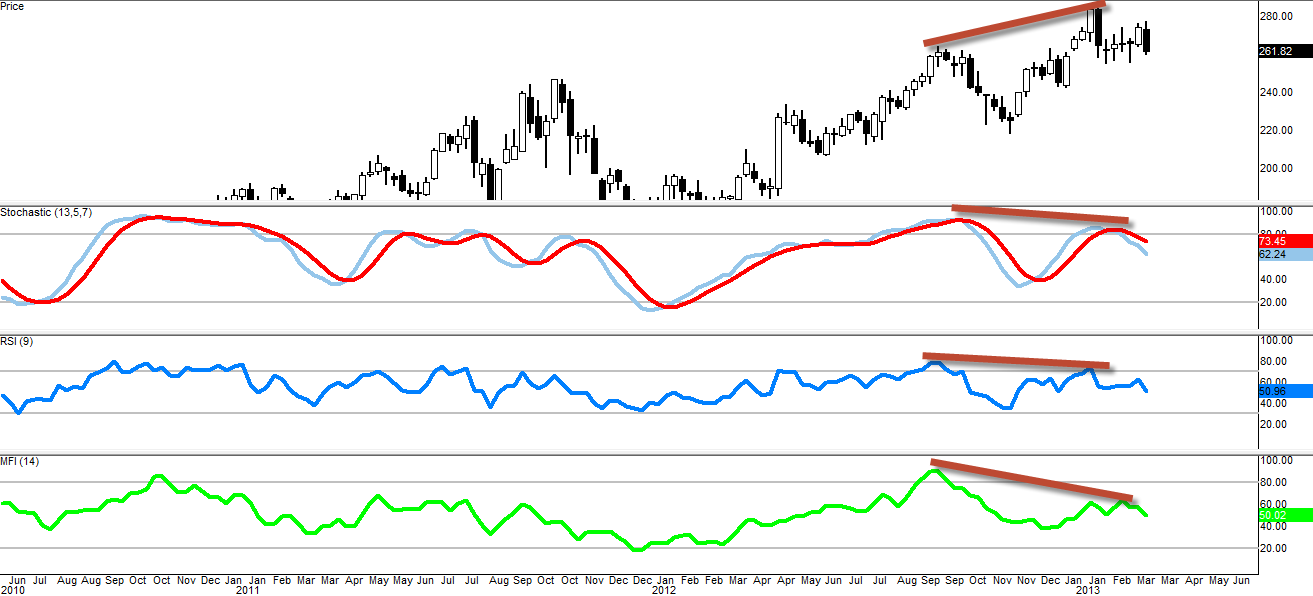
(Weekly Stock, RSI, MFI – updated 3.16.13)
We now have fully confirmed weekly bearish divergence on Stoch, RSI, MACD and MFI on this weekly chart. Out of these 4 indicators, MACD is the most important one as it is the Moving Average Convergence Divergence indicator that specifically measures divergences. As you can see on the MACD Study chart that we have fully confirmed bearish divergence with blue line starting to (Ever so slightly) pointing down. That would be the first step of confirmation. Obviously we would need to see some progress of follow through next few weeks but the early signal is definitely bearish.
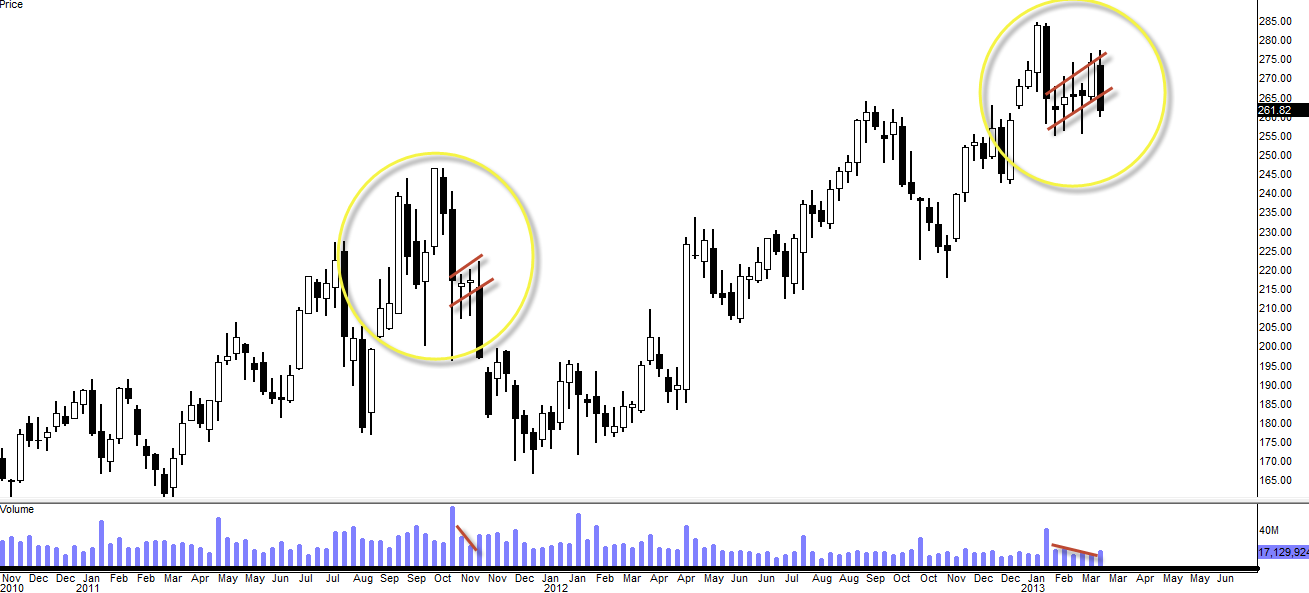
5. Reversal Candle I (Weekly)
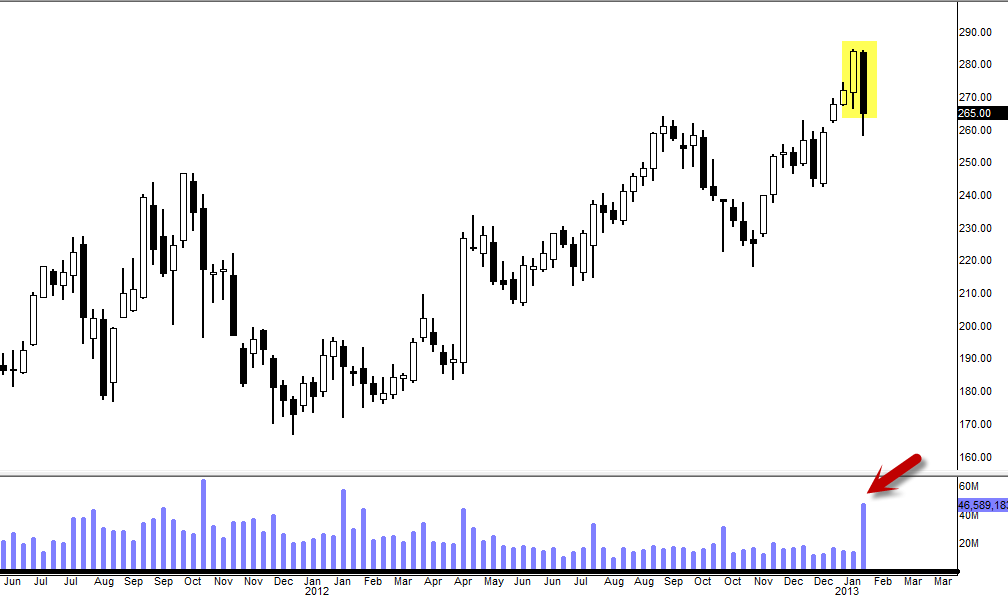
Bearish Engulfing reversal is in place on the weekly chart (week ended today so its a finalized candle) with high volume. That long volume spike indicates the potency and the seriousness of that candle.
6. Reversal Candle II (Monthly)
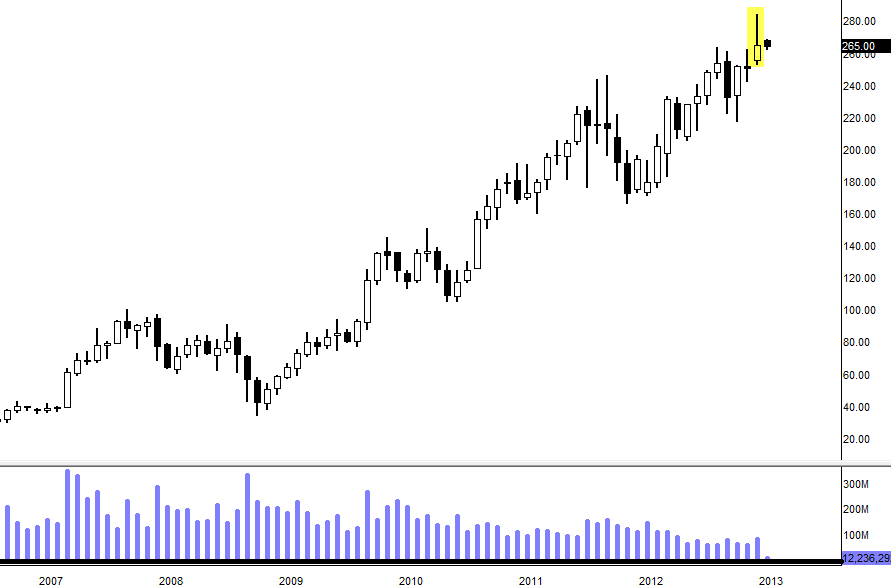
Shooting Star reversal formed on the monthly chart. Month has ended yesterday so this is a finalized candle. Take a look at this chart though. Last 6 years, we have not seen any Shooting Star candle which is the strongest bearish reversal candle in single candle analysis.
7. Volume Must Confirm the Trend (Monthly)
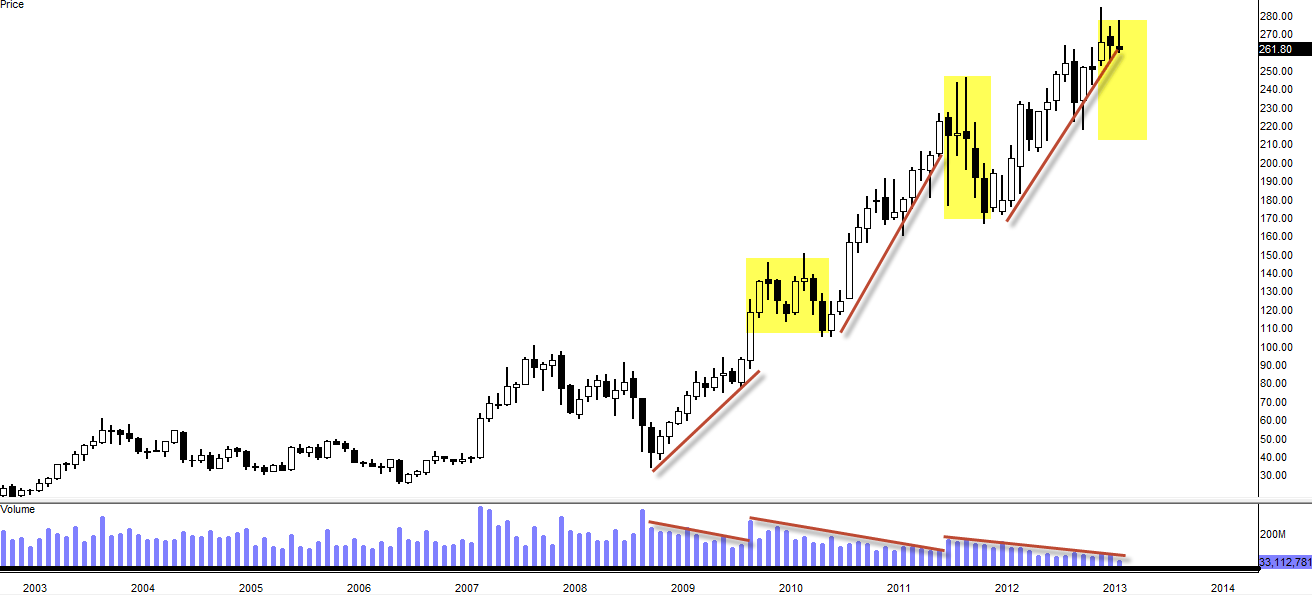
(chart updated 3.16.13)
Stock went up, volume dried up, stock declined. Expecting 2-3 months of bearish correction.
*Bonus Chart* Weekly Bear Flag Confirming
(chart added 3.16.13)
It has been total of 6 weeks of grinding higher while volume has been declining thus formed this unusually long bear flag. For second there I thought this bear flag was going to never play out (especially seeing the long white candle last week but as you can see last week’s white candle was not backed up by volume and this week, bears rushed in). Sellers rushed in and took over the lead last few days to end the week with dark candle on this weekly chart. For this bear flag to be completely confirmed, we would need to see $AMZN closing below $264 level after Friday EOD (finalizing the candle)
*Bonus Chart II* Daily DownTrend Channel Established
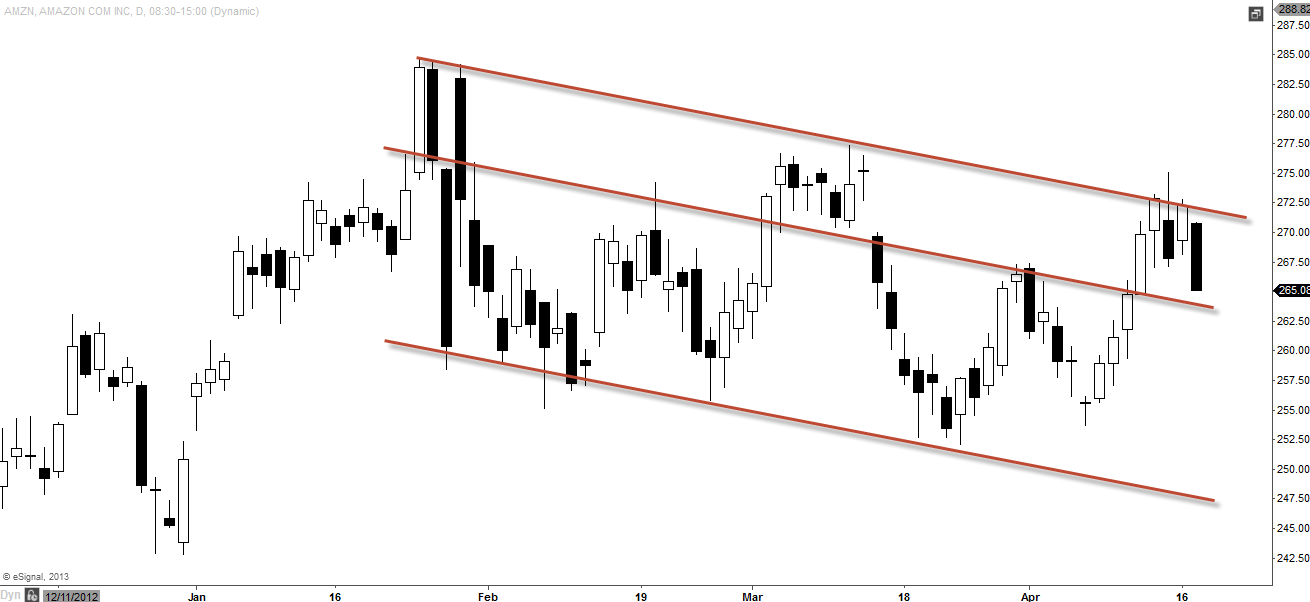
(Chart added 4.17.13)
These downtrend channel could be a lethal sign when it happens at the top of it’s long term bullish trend. Also we have so many other bearish reversal indications to add to the fuel. We don’t know how long it’s going to continue to oscillate in this channel area but once it breaks below out of that lower channel support, I expect fast downside movement.
[divider]
[divider]
(Daily) First Target: $240-$235
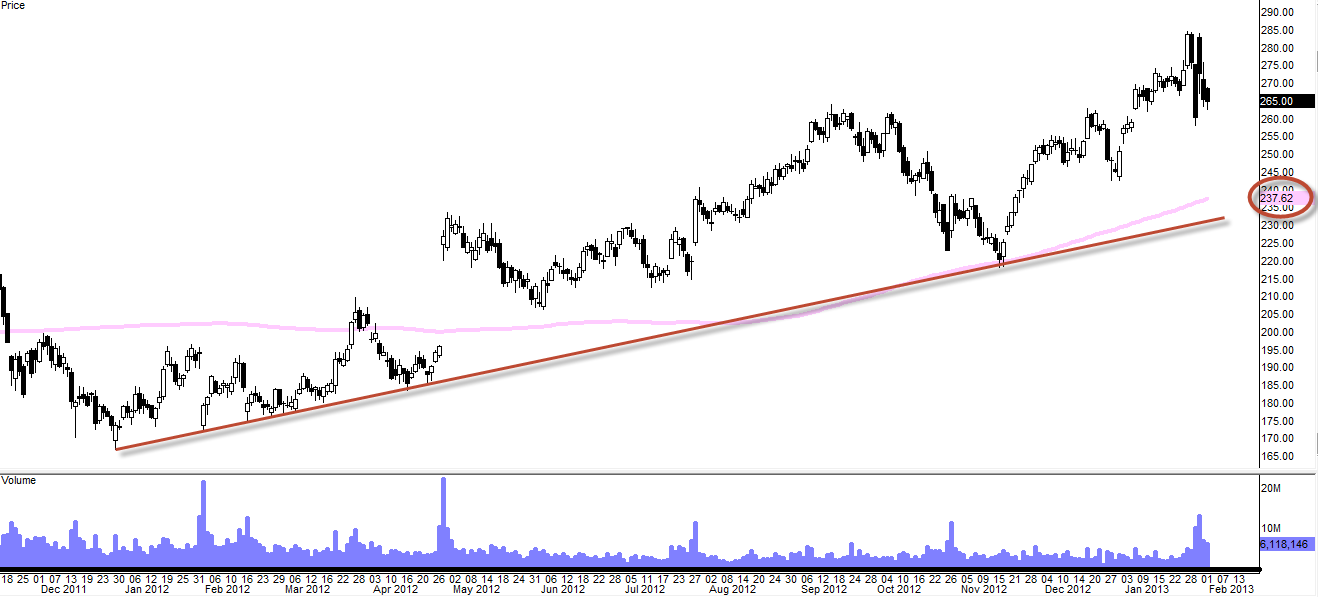
200SMA (pink) is traveling together with long term uptrend support (red line). This is a double confirmation that this level will act as strong support.
(Weekly) Second Target: $220
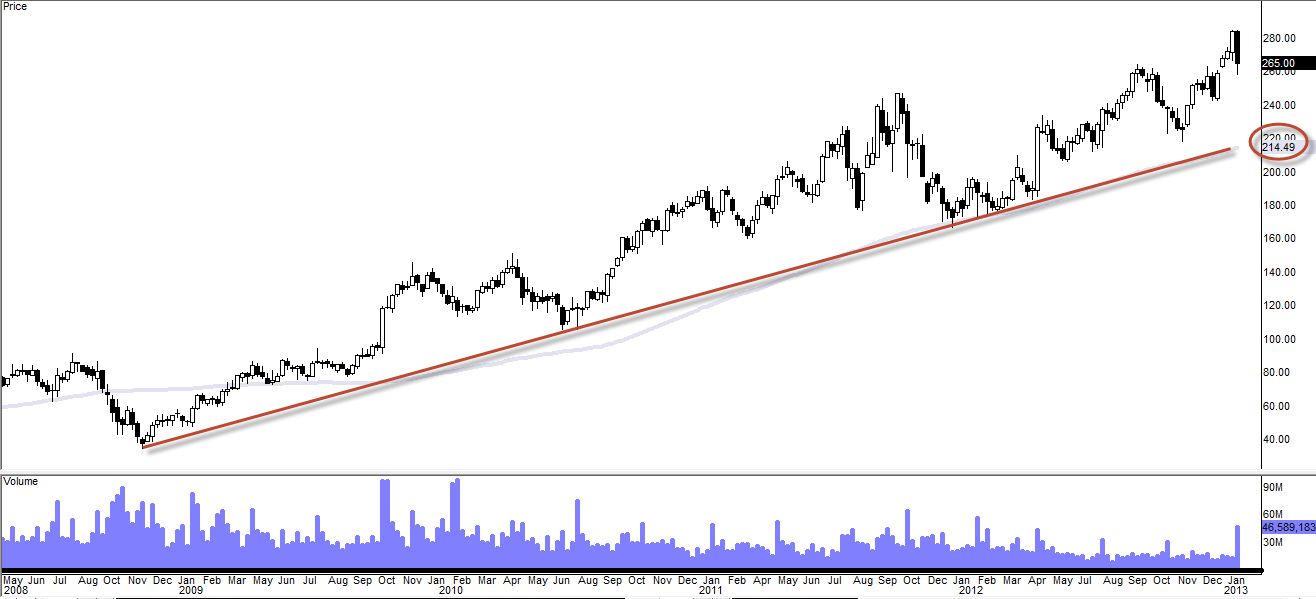
Weekly 100SMA (light grayish blue) and the weekly uptrend support (4 years of worth) are traveling together. This is also a double confirmation that this level will act as strong support.
(Daily) Ultimately: $200
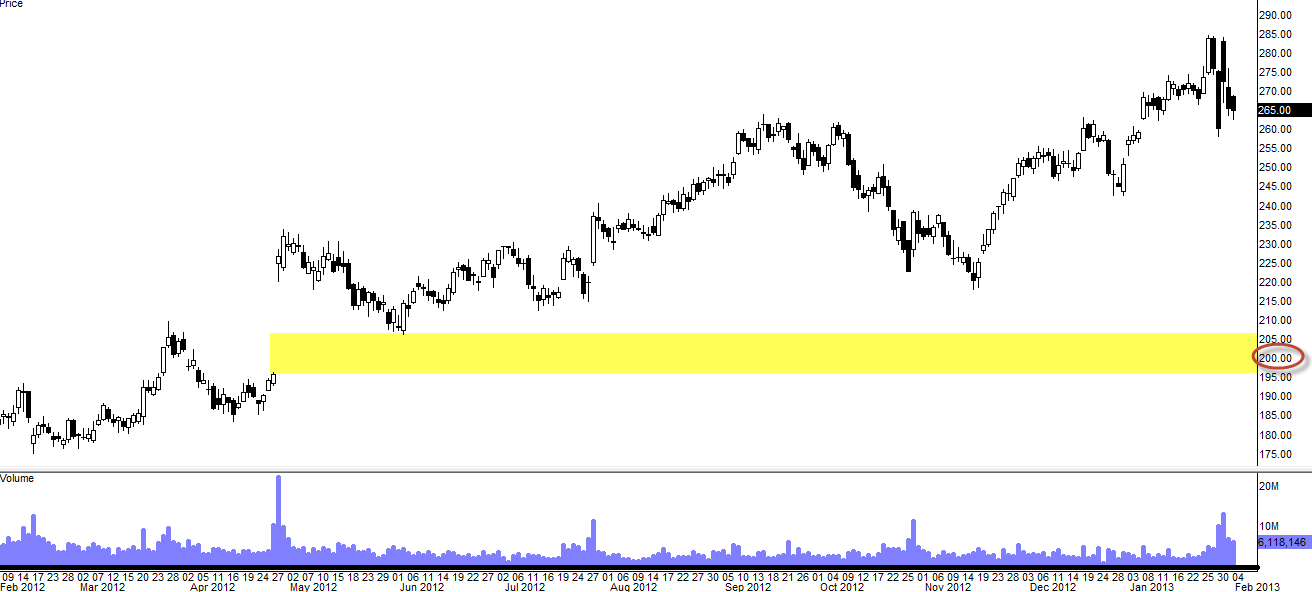
To fill the entire gap from 4/26/12
Fib Retracement Zone Confirms $220 and $200 (Weekly)
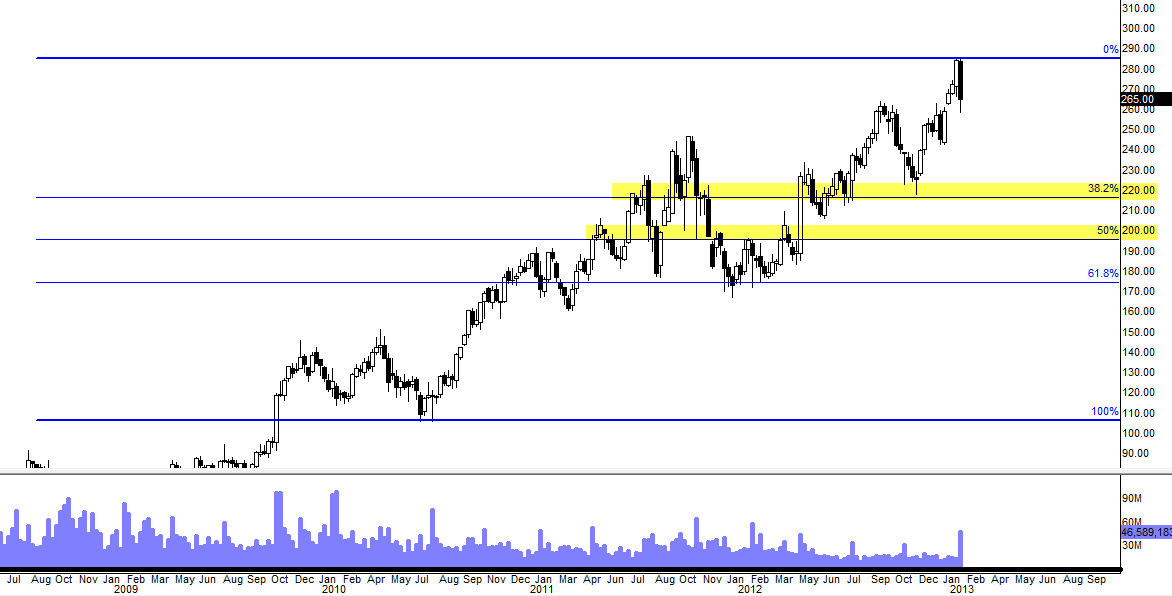
Fib Retracement zone confirms previously presented analysis on those possible support levels.
If Monthly Divergence Confirms: $170
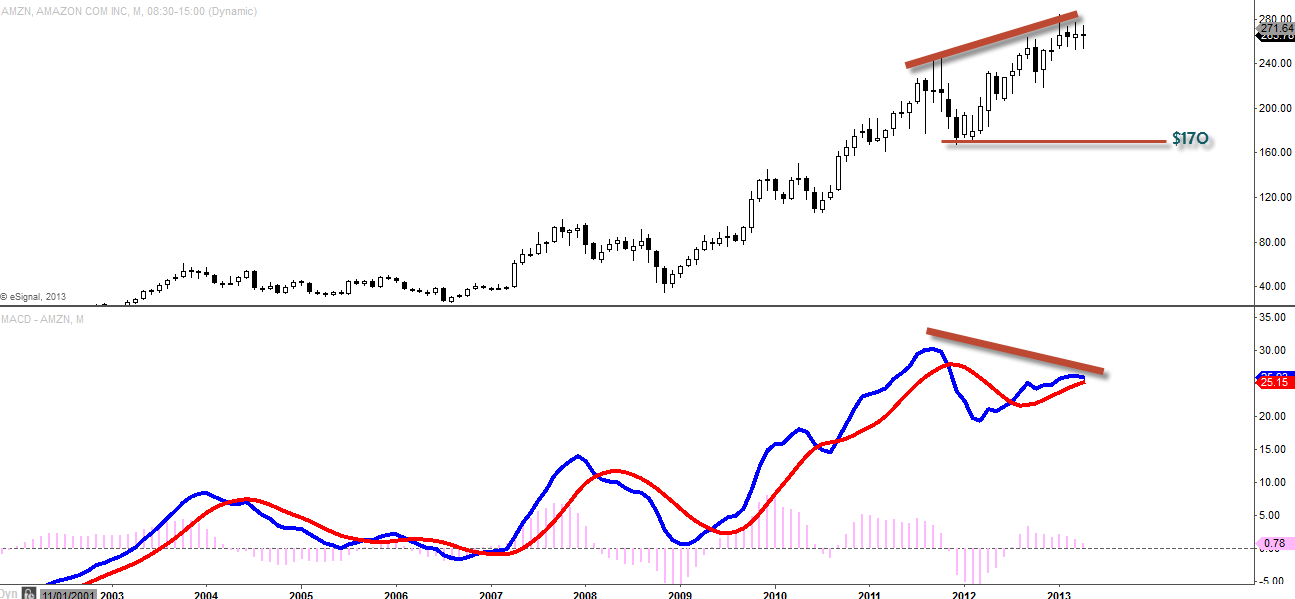
(Chart added 4.17.13)
This monthly MACD divergence is not yet confirmed but close. We will need to see the fast line (blue) to cross the red line to the downside and once the crossover is confirmed, that’s when this monthly divergence will be confirmed.
[divider]
[divider]
Key Signs of Major Correction
Pay attention to those daily and weekly bearish divergences. Similar situation happened on $AAPL when it was trading at $700. $AAPL had confirmed daily bearish divergence which later we had weekly bearish divergence confirmed after it started to roll over. Last time when $AMZN had confirmed weekly bearish divergence, it lost about $70 points in month and half. This time we are forming another weekly bearish divergence that has already been confirmed with daily divergence, I think 80 point drop to $200 isn’t extreme in my opinion.
Also monthly chart with declining volume is troubling as trend must be confirmed with volume (Dow theory). I prose $200 as ultimate target but we could find some support on any of those major supports I have mentioned above. Take heed and be cautious.