[divider]
1.18.13 Friday | Weekly Charts
[divider]
$DJIA
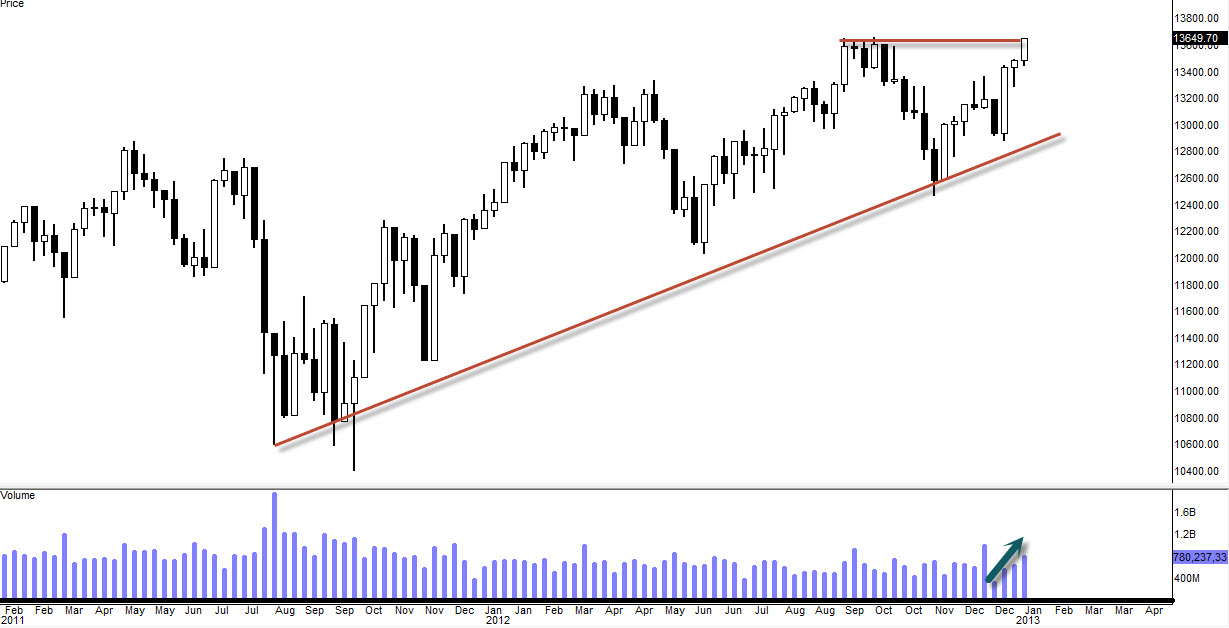
Dow Jones showing great strength here. Last three weeks of bullish run has been supported by increasing volume which solidifies the move however currently trading just below our resistance level so maybe some hesitation is in stored coming week. Again this a weekly chart so on a daily basis, we might see some slowing down action this week or possible corrective move. As of now we do not have any reversal formations on this weekly chart other than we are running into a resistance.
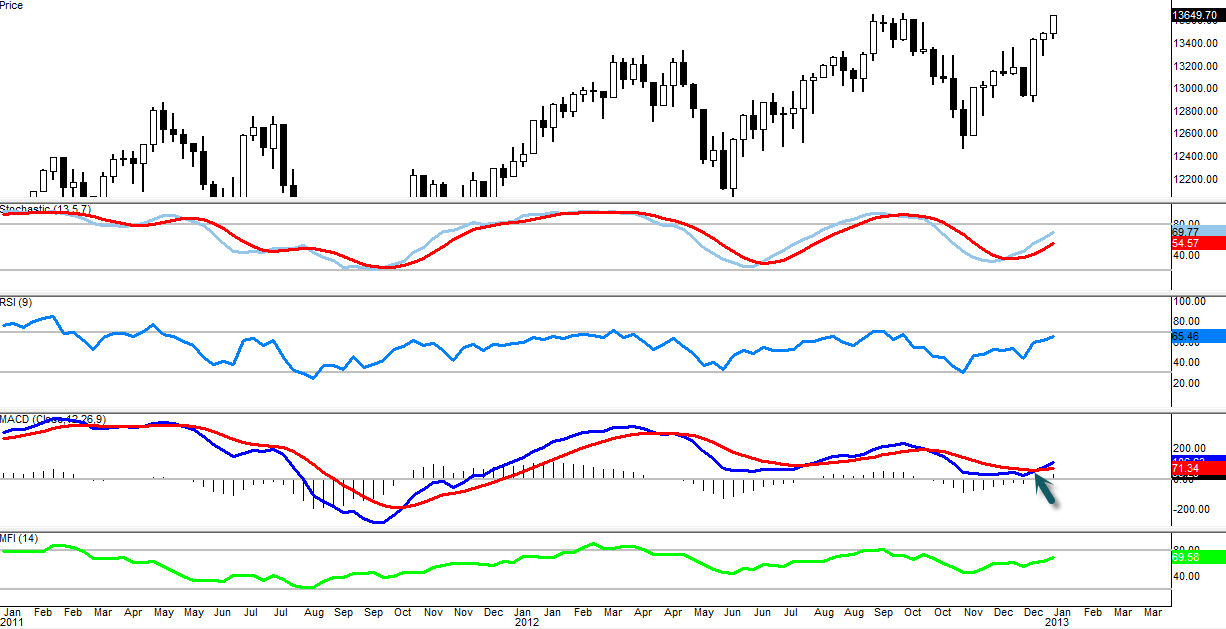
Stoch also showing great sign of healthy trend here, though it is starting to reach overbought territory but that does not mean it can’t continue to stay in that overbought territory while the stock continue to soar. RSI similar story there and RSI is little bit more sensitive to it’s movement so usually it’s the first one to point up or down depending on it’s price action so if we get bearish candle end of next week, expect RSI to point down.
MACD lines has been just crossed and this is very bullish signal especially looking at this weekly chart. I’ve been talking about this bearish MACD divergence on it and we still have that and it never played out. I am not sure if it’s going to play out but so far it is looking very bullish according to MACD and it says there are more to go. MFI is also heading to top of it’s band here and again it can continue to stay at overbought territory for a while so just because it’s reaching overbought territory, does not mean it has to roll over.
$COMPQ
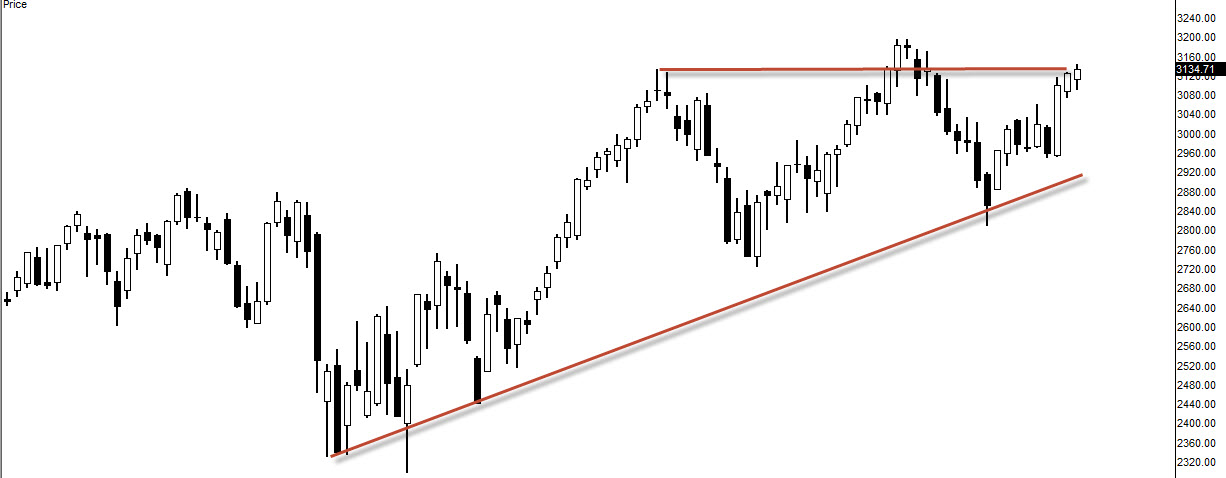
Looking very bullish here on this $COMPQ weekly chart as well. I have been watching this chart as I was anticipating possible Head and Shoulders formation and it’s still possible but with the overall market being very strong, I am not sure if it’s going to play out. As you can see on that horizontal resistance line which that could possibly be a right shoulder but then again we don’t have any confirmation of roll over. Until we do have confirmation of roll over (it’s going to be at least few weeks of worth to confirm it), I remain bullish in this market. Oscillators are showing very similar strength as $DJIA.
$SPX
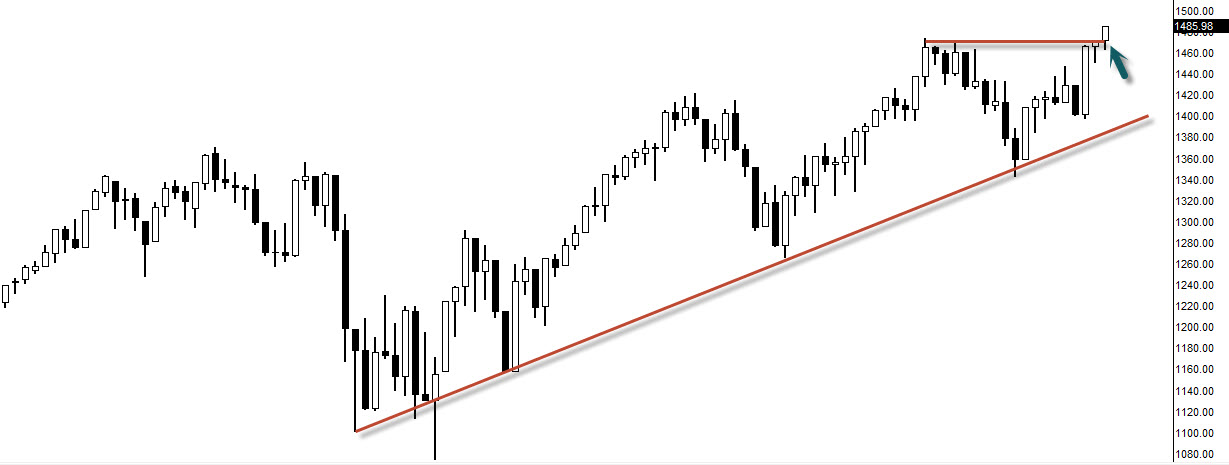
S&P 500 is the leader out of three as we have just broken recent resistance line and now trading above that. Keep in mind this is the weekly chart so that the last candle you see is finalized which is the confirmation that the recent resistance has been broken. That doesn’t mean it has to go up but it means it has very high possibility it will. However since this is the weekly chart, we might see retest of that resistance as new support going into daily actions this week. Oscillators are also very similar to $DJIA.
Recap
While $DJIA and $COMPQ is showing great strength but trading below resistance level, $SPX has pushed through the resistance. I continue to remain bullish in the overall market looking at the weekly chart unless it shows me reversal candle ending of next week.
However take a look at the video from Bloomberg on 1/10/13. Tom DeMark says to sell.
[divider]
[divider]