12.15.12 Saturday
(Chart below posted on 1/15/13)
Before you say it’s completely preposterous to suggest such price level, please let me first explain something.
I know many $AAPL investors already have been burned on this stock and lost much already and I am not here to poke them on the sensitive spot or get them irritated with this article. I am here to simply warn you and others like I did back in 9/28/12 when I called out $AAPL crash that is on the horizon (You can read about that article here “$AAPL – 10 Reasons of Why I am Extremely Bearish“). And I hope I am wrong so $AAPL can see some light again and I really don’t care which way the stock moves as long as it moves as I trade both way so I am simply sharing the intensive analysis I did on $AAPL.
I am looking at next major stops of $480, $440, and $360 in about 2-3 months and I will explain further on this article why I think $360 is not an obnoxious number.
Obviously you can imagine how many hate-mails I’ve received for writing such an article back in late September and that’s the problem about cult like followers and investors on $AAPL. They don’t ever want to take heed of opposite side of the story. There is always other side of the coin and you have to make sure to keep an alert of every possible angle before investing on any stock. You got to invest/trade smarter. Back in September, many (not if all) were so fixed on their blind love for the stock that it would go up to $1,000 per share, many analysts like myself banked betting on the other side. And now many are so convinced that $AAPL is so cheap to get in but I am willing to bet on the other side yet again.
So this is going to be technical heavy article and I am going to go very deep with my analysis to provide best technical analysis available on the blog today and hopefully this time you may take heed and take caution. And market is always going to do what it wants to do and I might be wrong as I have been wrong many times in the past so don’t listen or follow me blindly but always do your own homework and make sure to make your own decision on your trading.
NASDAQ Composite Index
Before doing an analysis on $AAPL, we have to make sure where the market is headed as a whole because that would make a huge impact on this stock. And $AAPL being huge contributor to NASDAQ index, let’s look at that and see where it might be headed. (You can also check out my recent article, overall market crash warning signs for 2013)
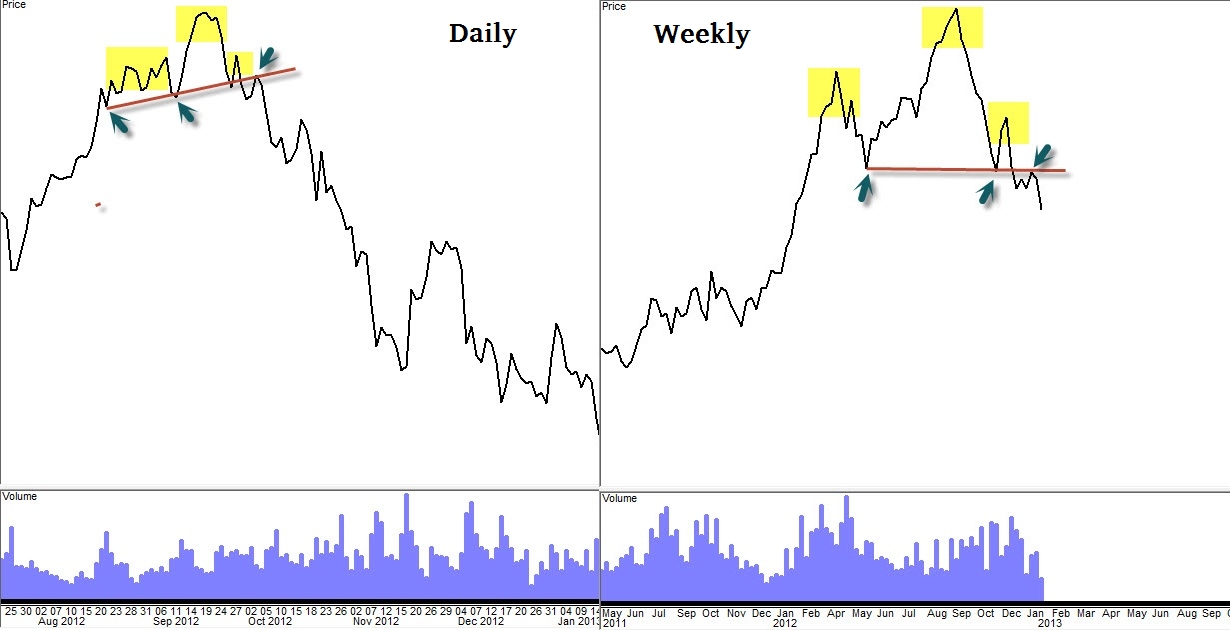
($COMPQ (NASDAQ Composite – Weekly Chart))
What you are looking at is this massive bearish divergence on MACD that has been formed. In 2012, we formed very steep and nasty looking bearish divergence that it looks like big down fall is on it’s way. If you think the divergences don’t mean anything, make sure to take a look at 2007-2008 MACD divergence before the huge crash, you will think differ on these signals.
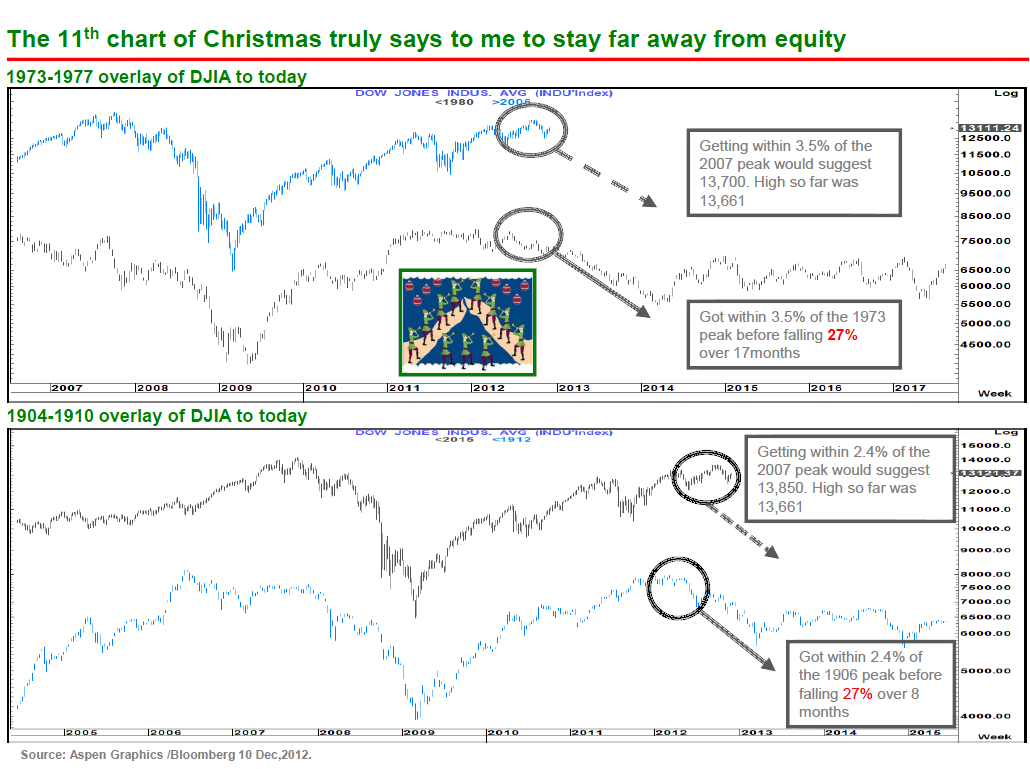
And yes these signals do not always have to play out but then again nothing always plays out. However the alarming thing about this signal is that we have 2 years worth of bearish divergences confirmed on $DJIA (Dow Jones Index), $SPX (S&P500 Index) as well. So all three indexes with 2 years of worth bearish divergences. Well I don’t know about you but I will take SPECIAL heed in the early next year for any optimisms in the stock market.
Also look at last three peaks on this weekly chart here. It looks like we are forming a weekly Head and Shoulders pattern in the midst of this bearish divergence. H&S is NOT confirmed yet on the NASDAQ, if anything it’s forming the right shoulder but when the weekly H&S is confirmed (by breaking the neckline below), it’s going to be ugly. So yes there is potential market fall that is about to come in the market early next year and this means NO GOOD for $AAPL since $AAPL has already been in this downtrend for 2-3 months now and $AAPL is also formed weekly Head and Shoulders pattern and currently trading at the neckline.
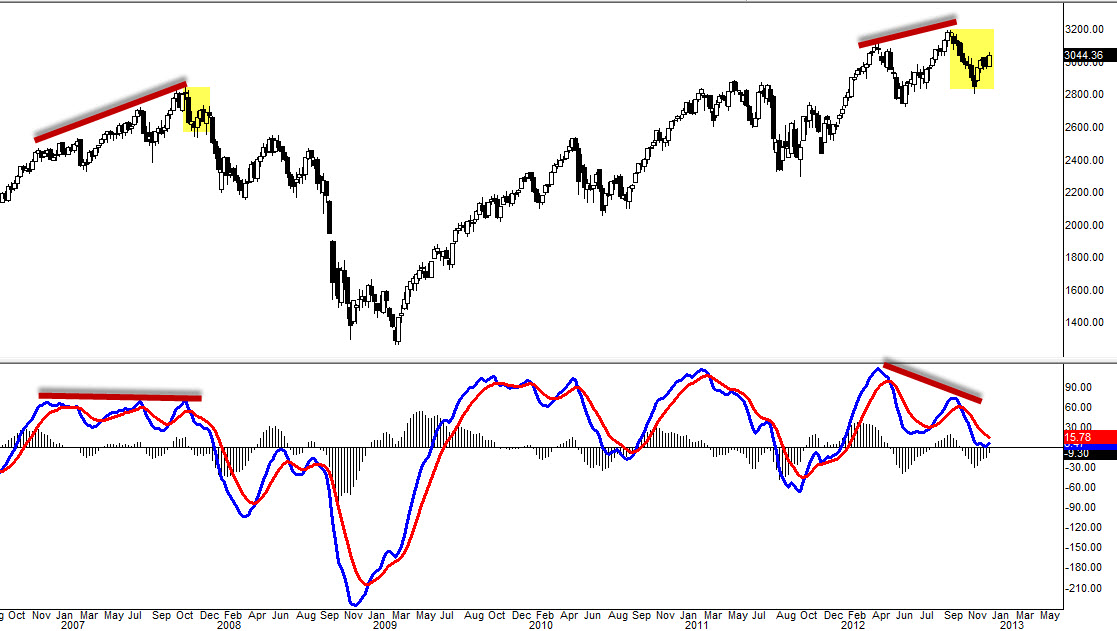
(Interesting chart from allstarcharts.com on $DJIA Dow Jones Index)
Now let’s look at some $AAPL charts, its formation, different time frames, pivot areas, trend lines, and Fib levels to see what we can find out…
Let’s Talk $AAPL
Weekly Head and Shoulders Neckline
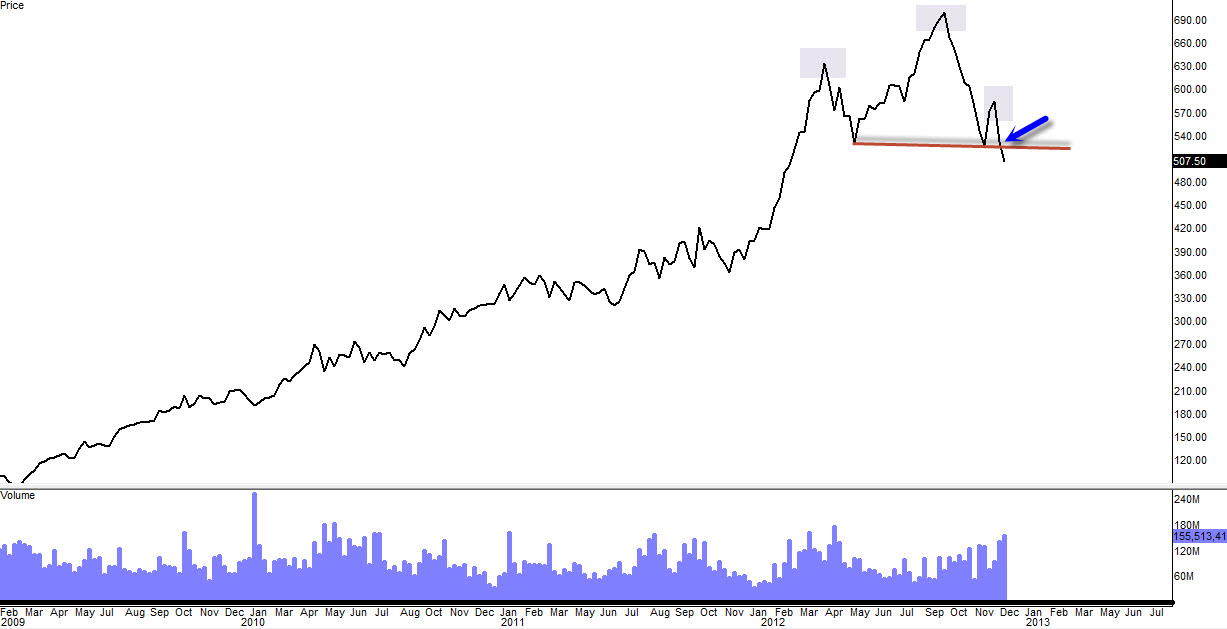
(Weekly Chart – Head and Shoulders)
Looking at this line chart, you can clearly see that we have broken the neckline. This is the early stage of confirmation of break of the Head and Shoulders. Of course the further confirmation is required and needed because it could have fake break out and goes right back up. But threat from the bears is definitely there. (You can read about Head and Shoulders lines and confirmations on $AAPL here)
Here are few scenarios that could happen next week. We might continue bearish and travel lower for few days and then all of sudden it will turn around and comes back up to test that neckline as new resistance. Many times when the H&S is confirmed, it likes to come back up and test the neckline but then again it doesn’t have to but it likes to. If the neckline resistance holds true and when it rolls over, the true H&S power will be revealed. Just check your last October daily chart on $AAPL. We had daily H&S confirmed, it broke out and then came back up to test the neckline and from there on, it tanked.
So my big concern about $AAPL is that we have breached neckline last Friday and this is where everything could begin. Everything I mean another strong bearish run down.
Recent Support @ $505
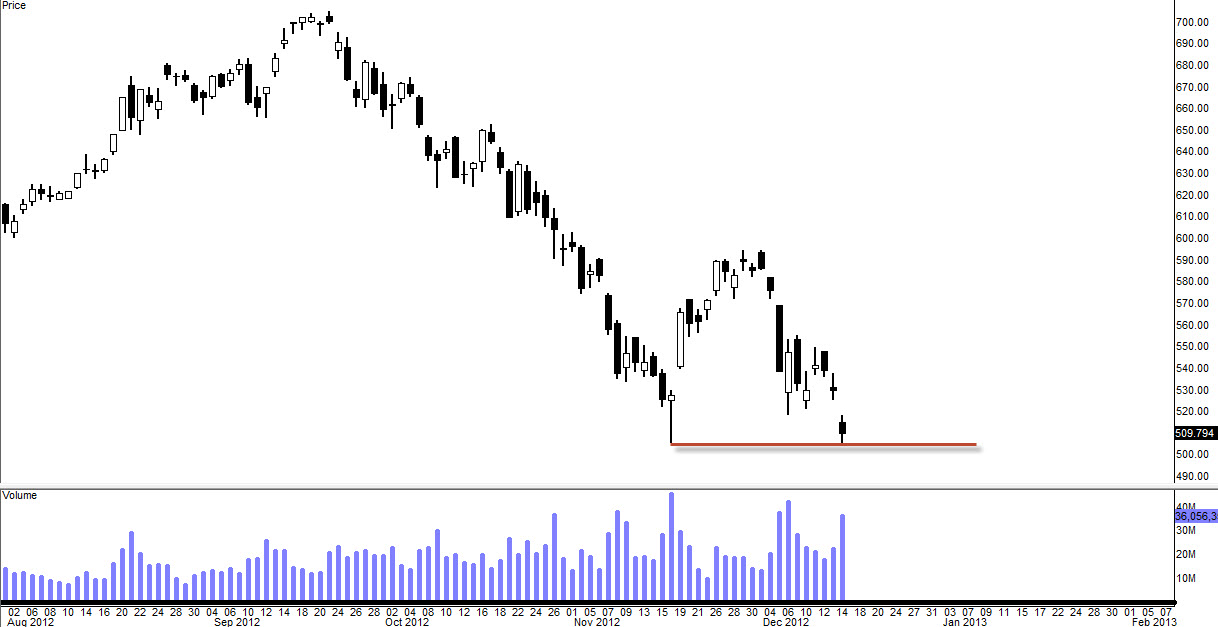
(Daily Chart)
Bulls are barely dangling around at the recent support of $505. This $505 is area is not a strong support area unlike $520 which was the major pivot/support area which that had been broken last Friday when it gaped down. But that lower wick from 11/16/12 Hammer, could work as short-term support and possibly we could bounce on Monday.
What we could possibly see next week is that we might find some support at this level and travel higher to test that $520 area (and fill the recent gap) as new resistance and if that $520 resistance holds and rejects the price, we would just continue with bearish move which I do think it’s likely that could happen sometime next week.
Next Major Support @ $480
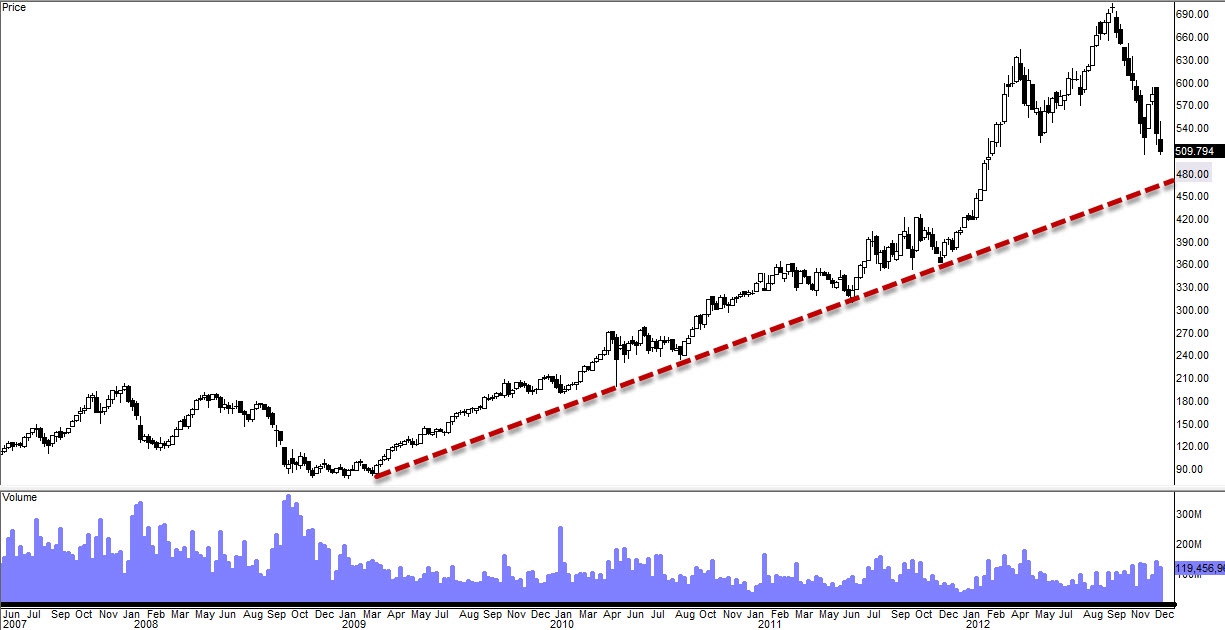
(Weekly Chart Uptrend Support)
This $480 uptrend support also in-syncs with $480 gap area support (double confirmation, double the authenticity)
If we continue to roll over, $480 is going to be the next major support. This is going to be a very strong support because this uptrend support has been established over 4 years of time. I do think this is going to be acting as very strong support which is going to be hard for $AAPL to crack. It’s possible that we might find some support and bounce to the upside at this level and come back up and test that $500-$520 level as new resistance. Like I’ve mentioned it earlier, when H&S is confirmed, it likes to come back up and test the neckline and if the neckline holds and rejects the price, bearish trend will continue. Since this is a weekly Head and Shoulder pattern, the real neckline testing could happen from this level.
Another argument could be, well we’ve accumulated so much bearish momentum on this stock when we get to this price level (by then we would’ve had weekly H&S fully confirmed) and possibly we will plow right through it. Because if we find enough bearish momentum to get to $480 level, that weekly Head and Shoulders is fully playing out and with that momentum coming down, I am wondering if that would be strong enough to break this support of $480 right out of this chart. Maybe or maybe not but nonetheless $480 is going to be very important level to watch out for.
$420 Gap Area Support
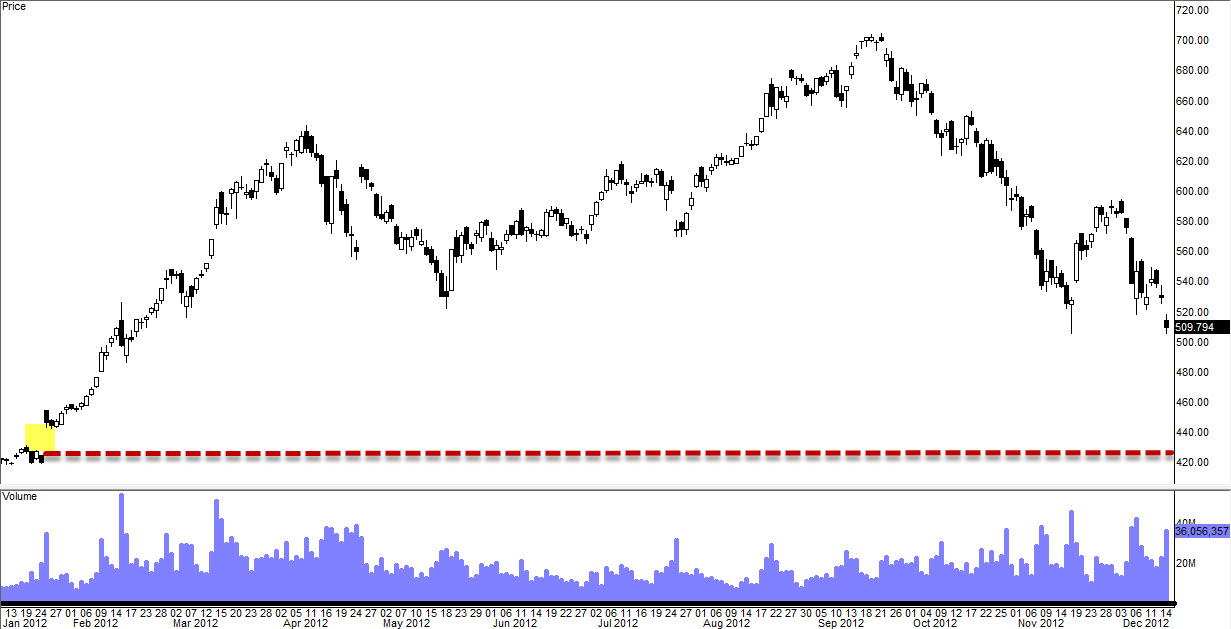
(Daily Chart)
So if we break $480 support and continue to head south, $AAPL is headed to fill that gap around $425 level. I do think this is where $AAPL bears would struggle and possibly bulls come back and turn things around all together. Possibly we might have some sizable bounce to the upside at this level. I do think at this level we might find some good amount of buyers who is looking to put some money back in for long term investment for $AAPL.
Let me say this. If we find enough buyers and solid base building activity happening at this level, we might not even get to $360 level. If we are still lingering around at this $430-$420 level close to the 2nd QR, I’d think this could become the ultimate bottom for $AAPL. I mean I would have to re-evaluate and do my analysis again when we get to this level but I do believe this is pivot is where many investors, traders will be looking at.
But here is my REAL reason of why I think we will also break this support and continue to travel lower. It’s the weekly H&S projected price level.
$360 Is The Weekly H&S Projected Target ($140 Drop)
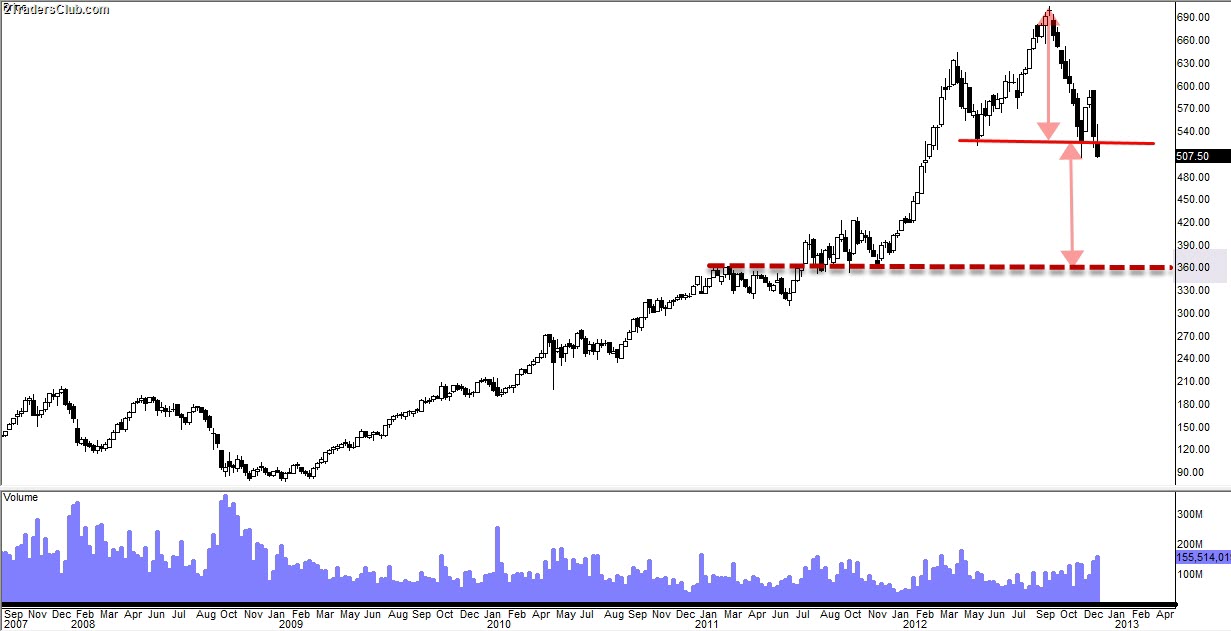
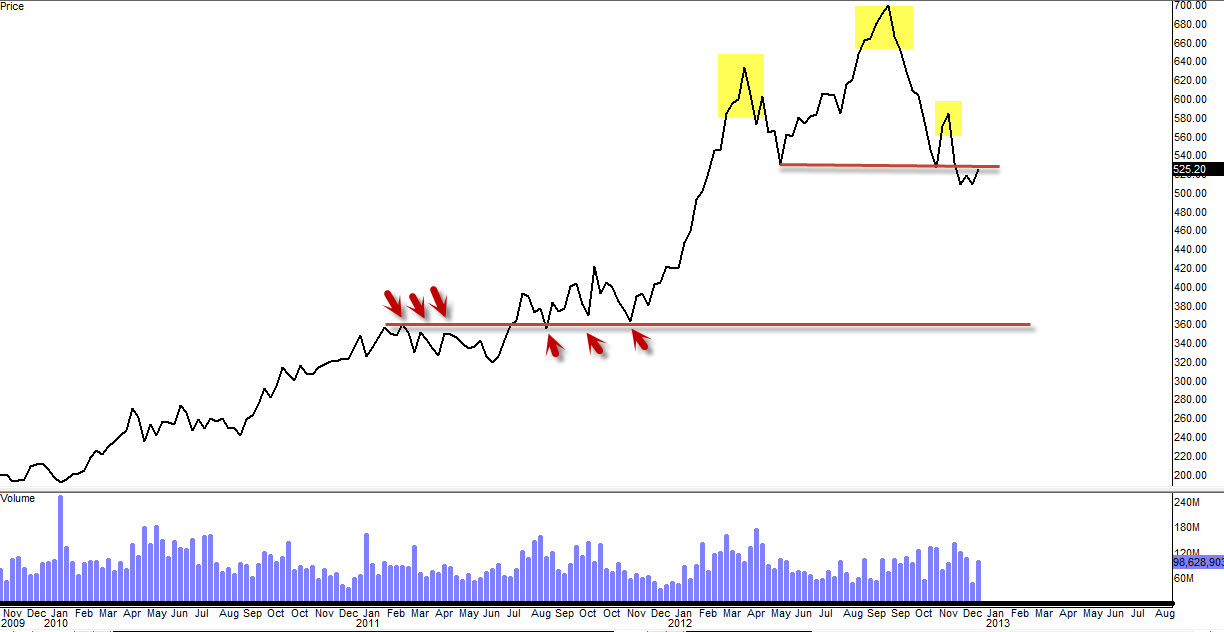
(Weekly Chart)
That weekly H&S projected price target of $360 also lines up perfectly with next major support at $360 on weekly chart as you can see in the red drawn support line that coincides with H&S projected target. Projected target is pretty simple to identify. The price movement from the top of it’s Head and to the bottom of it’s neckline. You take that price movement which is about $140, and you measure it from the neckline to the downside and that comes to $360.
Weekly Pivot/Support Confirms $360
And here is fascinating facts about that $360 level. Other analysis confirms that price level. Double, triple or even more confirmation is very good thing in Technical Analysis. You remember my $110 drop analysis back in late September? The huge part of that analysis was not that we had some reversal patterns but the big part of that analysis was that we had multiple reversal patterns confirming each other and on top of each other. That was why I traded very heavily on the bearish side back in late September while everyone else was bullish on this stock.
Today we have something similar happening about the price level of $360. H&S projected target is now also confirmed by next major pivot area. This confirmation alone tells me that there is a high probability (if weekly H&S reversal is confirmed) that that’s where $AAPL is headed. But that’s not all, we have more confirmation on that price level.
Weekly 200SMA Confirms $360
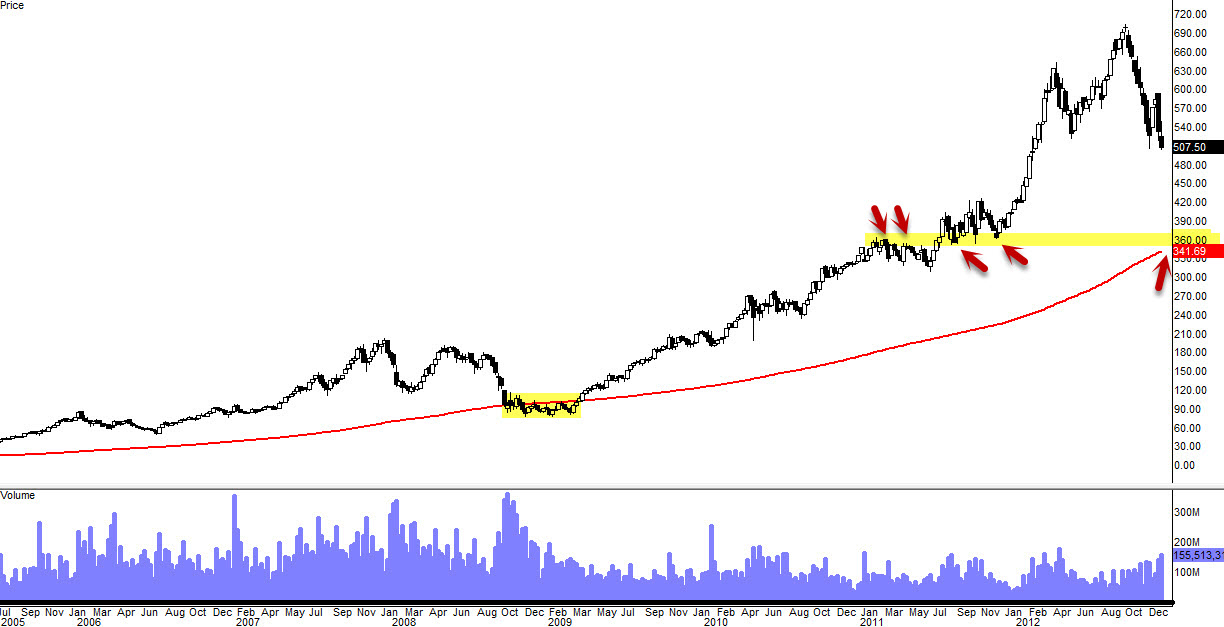
Take a closer look at late 2008 and early 2009. Weekly 200SMA has been served as critical level before $AAPL truly took off and 200SMA played a huge role in that. That was the historical moment for $AAPL to take off from $100 per share to $700 per share (700% gain) in just about 4 years of time. And that’s a big event and if 200SMA played that role, I do think we should take a special heed for upcoming event that could possible take place in this price level of $360. This weekly 200SMA possibly become another savior for $AAPL and if we find ourselves at this level of $360, I wouldn’t be surprised this weekly 200SMA will act as strong pivot area for it to bounce again.
All Time 50% Retracement Confirms $360
(From Top to Bottom)
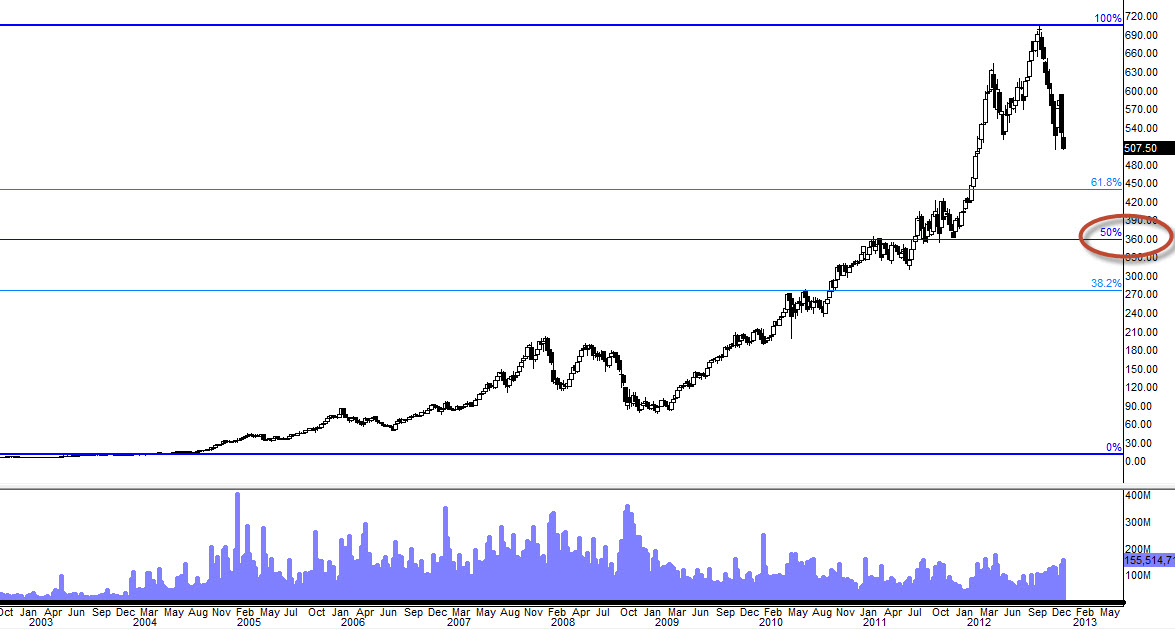
(Weekly Chart)
When or if soaring stock crashes, 50% drop is pretty reasonable I would say. Again weekly Head and Shoulders is the key thing here. We are still at a early stage to say that the H&S is fully confirmed and for this massive crash to play out, we will need Market as a whole to roll over as well. If $AAPL’s weekly H&S is fully confirmed with Market as a whole rolling over, $360 is not an obnoxious argument. I am sure many big fund managers are looking at similar price level like myself. And let me go further and explain looking at the monthly chart of why $360 will be my ultimate bottom of the bottom for $AAPL.
Monthly Pivot/Support Confirms $360
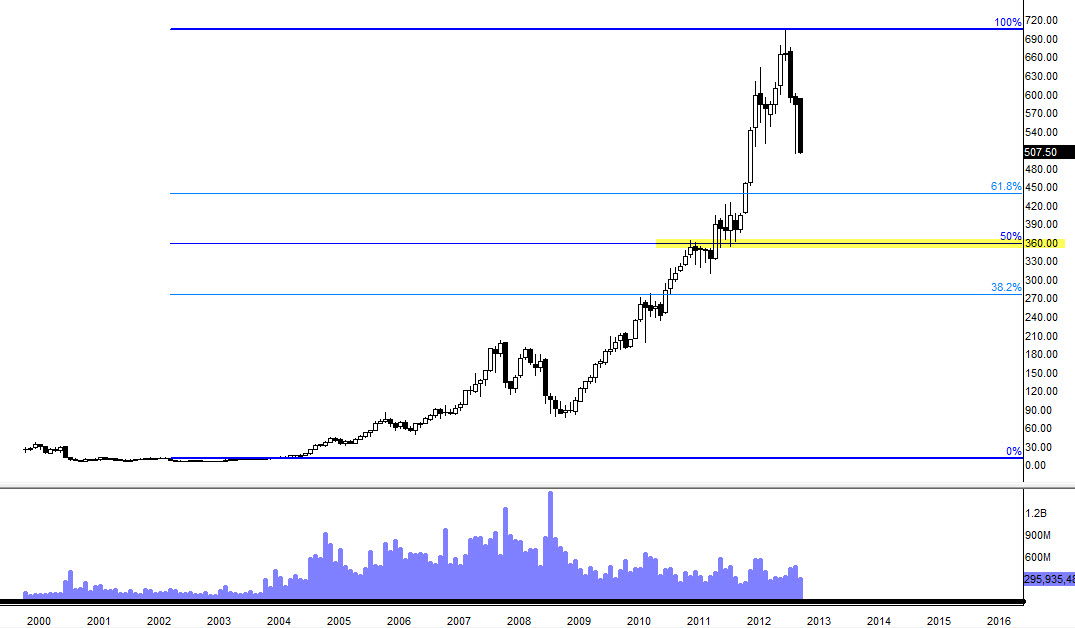
(Monthly Chart)
After monthly Evening Star reversal, this chart looks pretty ugly if you asked me but sweet to those whom are shorting the stock from the top. On this monthly chart, we’ve broken all the major supports at $550-$520 level and I don’t see any pivotal area until $360 level. You can see it on this monthly chart and you can agree with that.
So let’s recap.
- $360 has been confirmed by weekly Head and Shoulders break out projected target
- $360 has been confirmed by weekly pivot (support) area
- $360 has been confirmed by weekly 200SMA as pivotal price level
- $360 has been confirmed by monthly pivot (support) area
- $360 has been confirmed by all time 50% Fib Retracement level
And these are the reasons why $360 is going to be very CRITICAL and PIVOTAL level if $AAPL decides to move fast and furiously to the downside.
Last time they fully crossed to the downside was late 2008 so it has been almost 4 years since these two have been united (to the downside) so keep an eye on it. In the event that these two long term moving averages cross, that’s a huge SELL signal for big fund managers and many investors including fundamentalists. They all look at these long term moving averages.