
Weekly-Chart Perspective
Weekly Candle-Chart
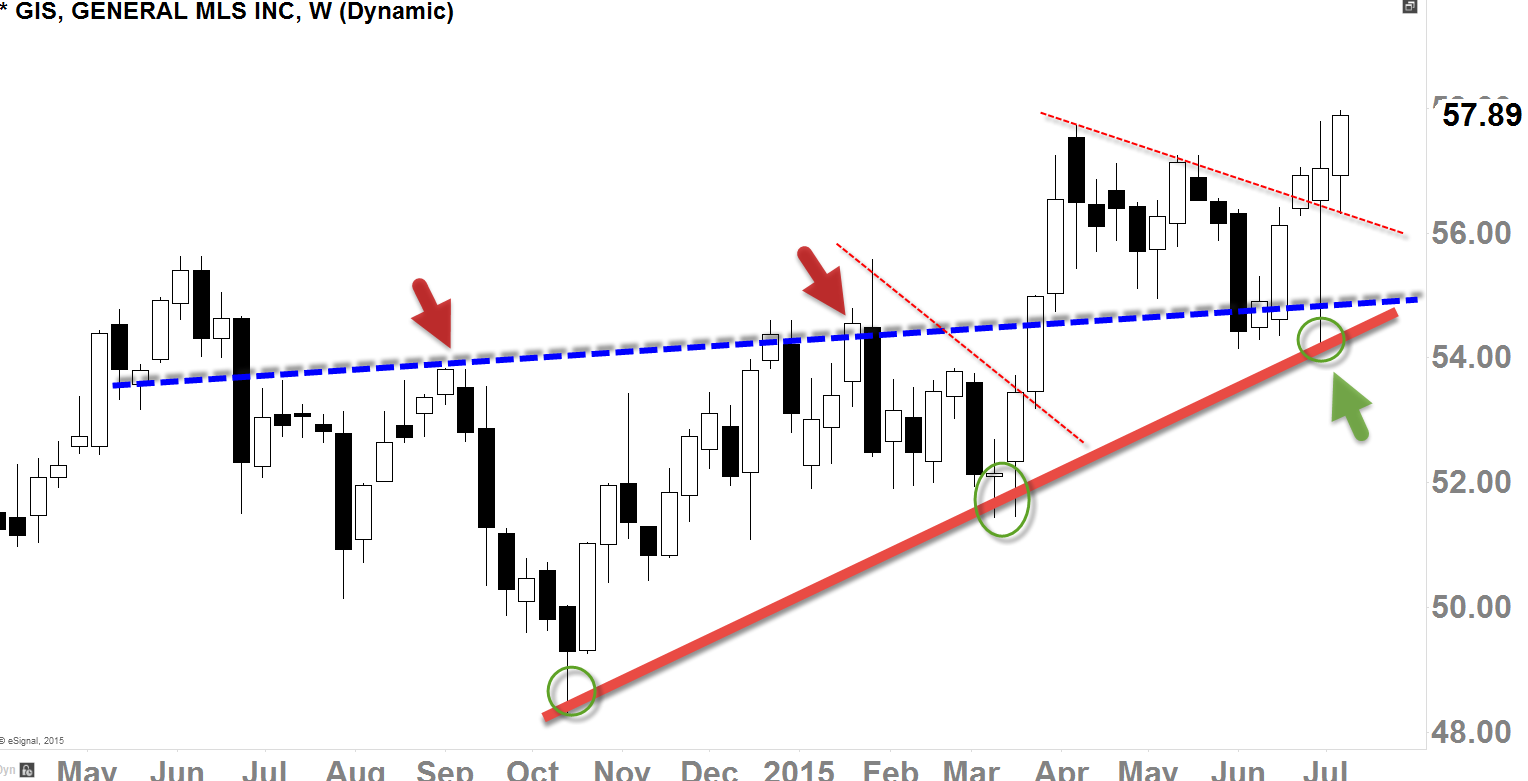
Looking at this close-up weekly-chart, we can clearly see that the old-resistance (red arrows) has now become a new-support (green arrow) which is the level also coinciding with rising-uptrend support (green circles); we pretty much bounced off of this level in June and we are seeing constructive follow through last 4-days after the earnings call. In Part 1, our target was at around $60-$61ish level, and I think we can still get there. Weekly-chart definitely looks like trend is healthy and could continue to the upside with its ups-and-downs in the minor to intermediate-term. If you pay attention to that green circles again in the above chart, you can clearly see that we are faithfully cultivating higher-lows, and it means primary-term trend is continuing to advance while validating the establishment of the rising-uptrend support.
Daily-Chart Perspective
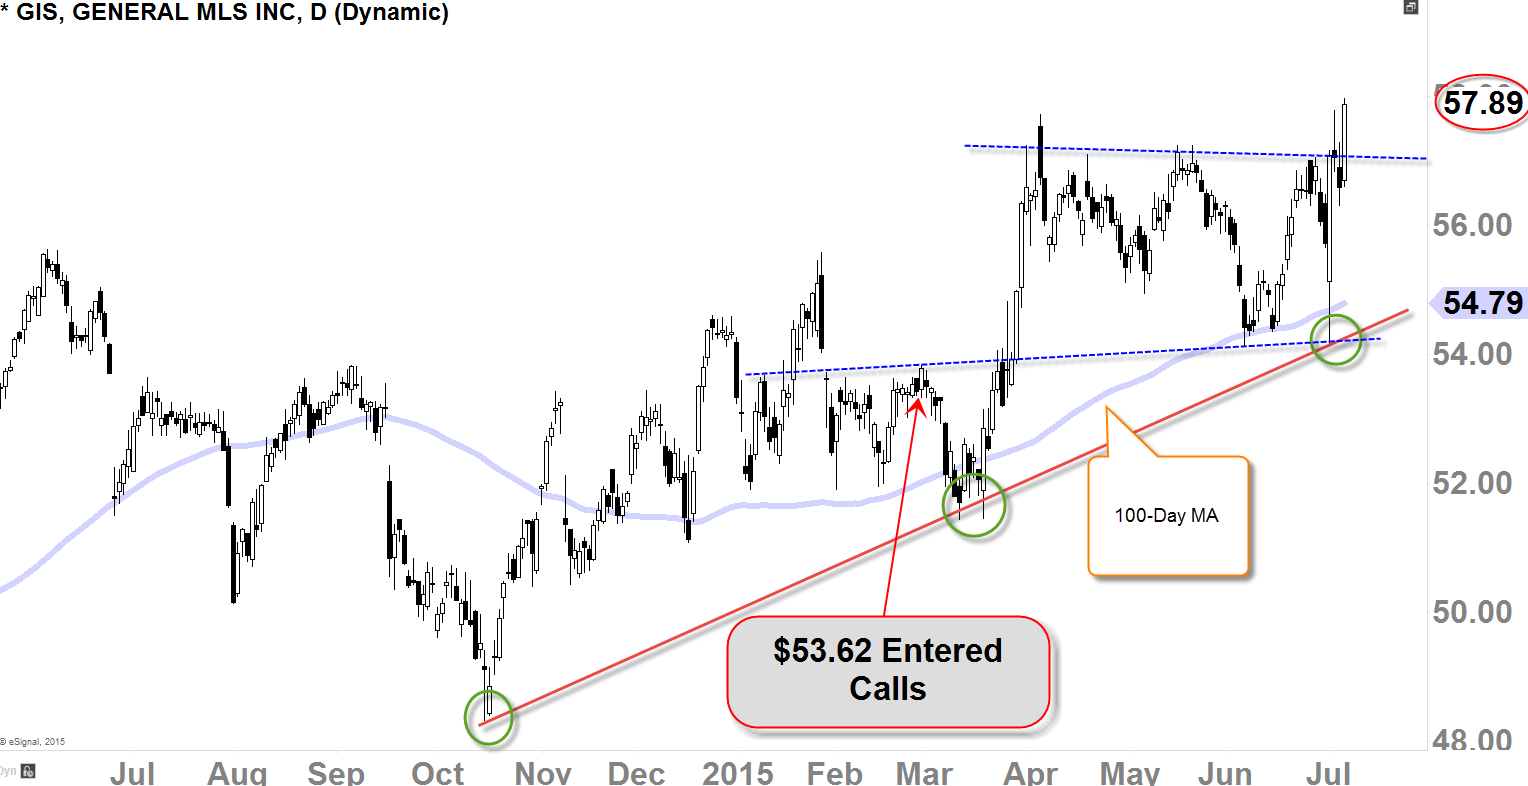
It’s not the most pretty looking daily-chart but if we only pay attention to the levels we only need to pay attention it’s not so bad as I have presented in the chart above with annotations. Rising-uptrend support (red line) with horizontal-resistances (blue dotted lines) give us clear perspective of where the sentiment is at, currently. 100-Day Moving Average has been faithfully acting as support since late-2014, so definitely we can’t overlook that neither. With today’s breakout above the horizontal-resistance above $57ish, it looks strong in the minor-term.
We are still holding our call-positions we entered at $53.62, and we will probably unload some off at around $60-$61ish. Still looks solid to me for the intermediate to primary-term perspective and the rest of this year.