![$SPY $SPX Tough Weeks Ahead for the Equities [Part 2]](https://2tradersclub.com/wp-content/uploads/2013/10/headwar_Warning_sign_orange_rounded.png)

[divider]
Related Articles
11.02.14 “$SPY $QQQ The Final Push [Part 3]”
11.30.14 “$SPY $SPX Tough Weeks Ahead for the Equities [Part 1]”
[divider]
MACD’s Insinuation
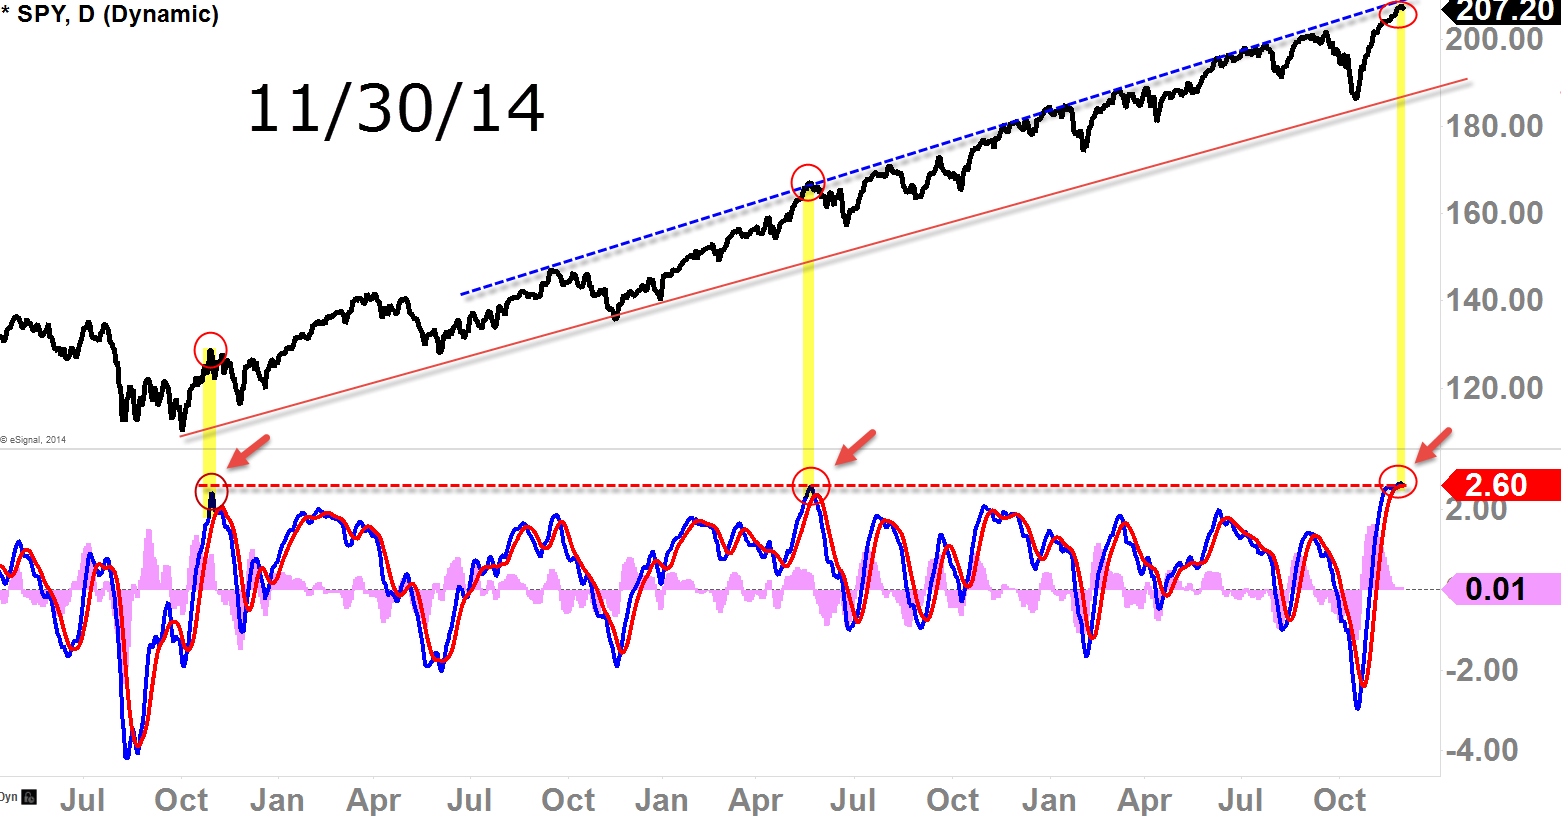
[Above daily-chart featured on Part 1]
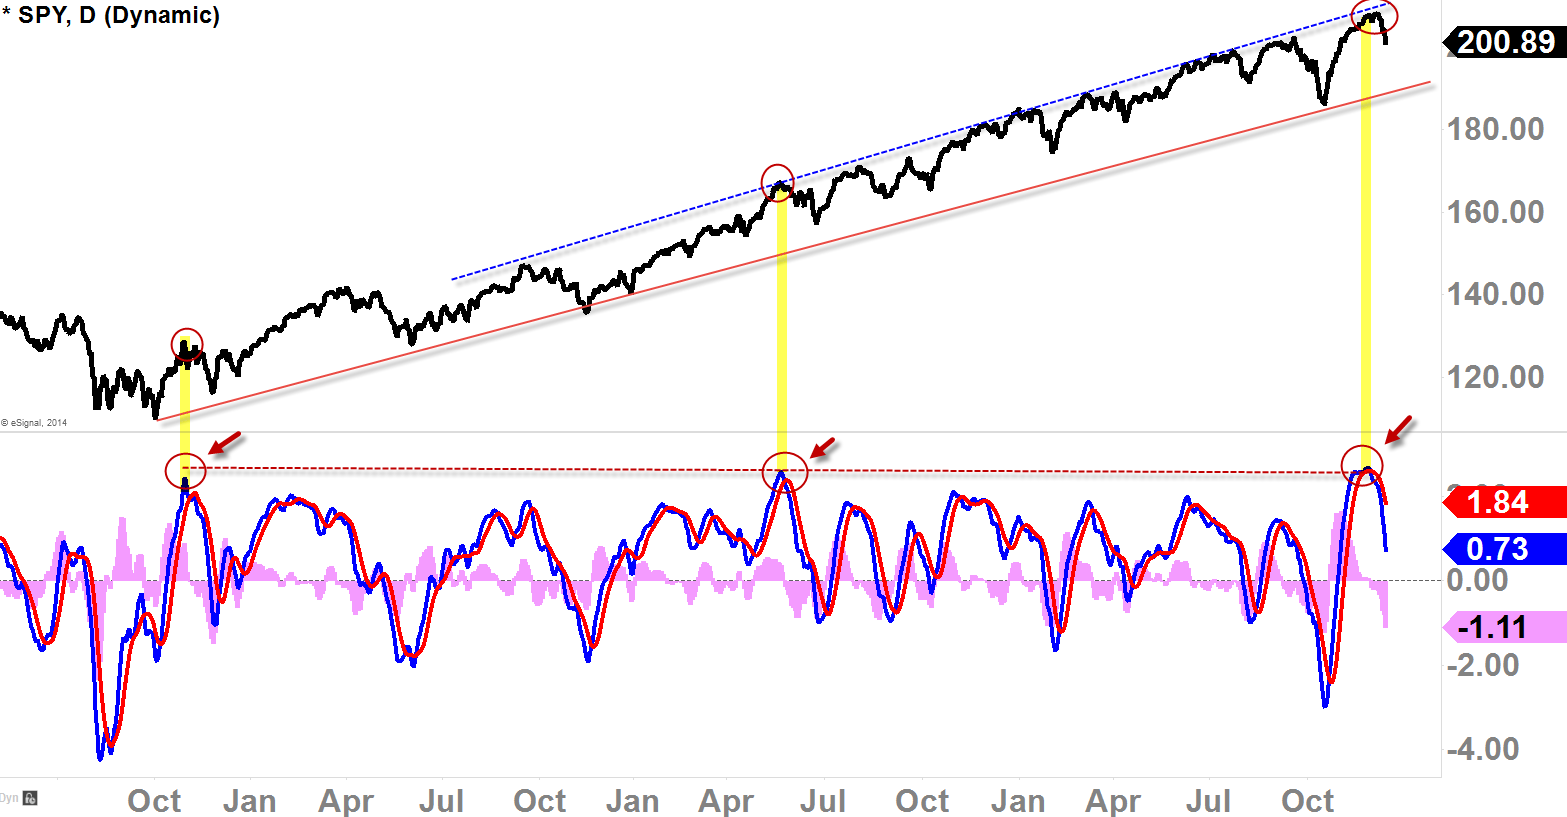
[Above daily-chart screened today]
As the $SPY hits $208 level about 2 weeks back, MACD was insinuating possible outcome. Was it possible to continue higher? Yes. Anything is possible in the market and sometimes we do see those unimaginable actions, however we must respect the “probabilities” aspect of trading because that’s what is LIKELY to play-out. It does not mean it has not play out but it means it has high probability of playing out. So it didn’t hit me by surprise when we start to see a pullback like this after an extended sessions we’ve had since mid-October. As the MACD hits that historical-extended level, price pulled back this week. We did close below 50EMA today, and that could be signaling that the sell-off could continue next week. But let’s talk about potential support levels to watch next week.
[divider]
Supports & Gaps
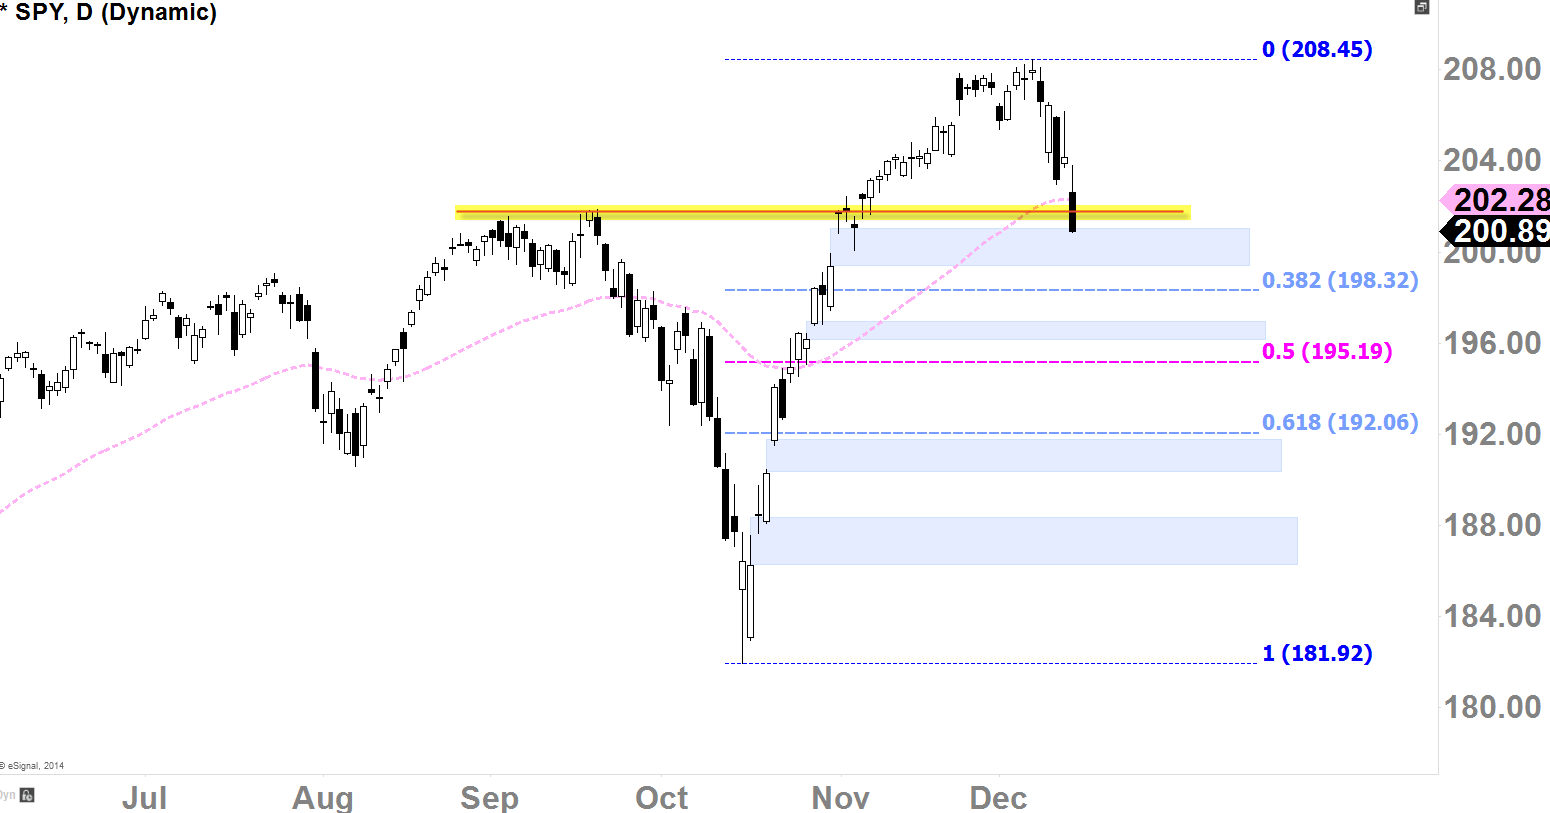
[$SPY Daily chart with gaps annotated with blue boxes]
Current Action
- We’ve broken below the potential pivot level today (horizontal highlighted)
- We’ve broken below the daily 50EMA
- As long as we stay below daily 50EMA and $202ish, ‘benefit of the doubt’ goes to the bears in the intermediate term
Support Levels
- $198-$200: 100SMA (daily), next gap fill, Fib 38.2% retracement
- $195ish: 2nd gap fill, Fib 50% retracement
- $190-$192: 3rd gap fill, 200SMA (daily), Fib 61.8% retracement
- $186: last gap fill
- $183: Primary swing low (this would be worst case scenario)
[divider]
Weekly Chart

Action: Looking at the weekly chart, I would watch 50EMA (weekly–currently at $192.24) for the next few weeks should the price continue to decline. $190ish level also seems like a good-support level to watch as the long-term uptrend-support line (red) is residing there.
Candle: We do have “Bearish Engulfing” candle this week with a Marubozu candle, and so if we get a follow through (to the downside) by the end of next week, it could get very ugly on the third week. Bulls can nullify this candle by moving sideways for 1-2 weeks and thrust back up by creating bullish candles that can immerse above this week’s bearish engulfing candle.
[divider]
Final Thoughts
The problem with this parabolic bullish-move we’ve had on the $SPY since the mid-October is that we didn’t establish any higher lows thus not-creating solid support levels but left with many vulnerable gaps. Gaps, obviously, don’t always need to be filled, but once the bears taste it, they might not want to stop, and we’ve got 4 gaps to fill to the downside. Gap-fills can be acted as support along with Fibonacci retracement levels so I would watch those levels as possible support levels. Because we are working with a prolonged uptrend in the index, watching the weekly-term chart could help to see the possible support levels as well (as I have depicted the chart above). Picking the bottom might be a difficult endeavor next few weeks so I would wait for a good confirmation of a bounce before gratifying the idea that the market has been reversed.
[divider]
SIGN UP FOR 2015 LIVE Mid-Week Update with Kay Kim
[divider]